


Here's your Playbook
Download now
Oops! Something went wrong while submitting the form.
Learn More
TABLE OF CONTENT
When you write an article, the nice thing is you get to set the scene so the whole story can play out. So here it goes:
#1 The notion of a “data product” is pretty new, so we don't talk about something that has been around for years or has a clear picture and definition. The phrase can mean multiple things, and people will have various ideas or interpretations when they see it.
#2 Most definitions come from the data mesh concept and are from a technical and architectural angle. This is interesting, but I need an important aspect: A product is only a product with users and impact. This is the angle I care about.
The work of Marty Cagan heavily influences my product work. I was lucky enough to start my product career with a one-week workshop with him at Audible, and his workbook became the one thing lying next to my keyboard for years.
He describes the building blocks of a product like this in this post:

The emphasis is that it requires an equal focus on all three parts, not just one (like we are customer-centric). If you miss addressing one of them, your equation (= Product) results in Zero.
This is an important aspect for setting the scene for this post. From what I read about data products, it is about technology.
Animesh wrote a good post covering a data product's technical aspects: Data-First Stack as an enabler for Data Products
But you need to learn more about the Customer and the Business aspect regarding data products (if you have such links, please let me know in the comments).
This post will not cover the foundations of both missing dimensions for data products. That’s something for a different post. Here, I want to look at the metrics angle for data products. But all three dimensions that make a product are essential to analyze the proper metrics. Therefore, I will pick each dimension and evaluate what metrics can help analyze it.
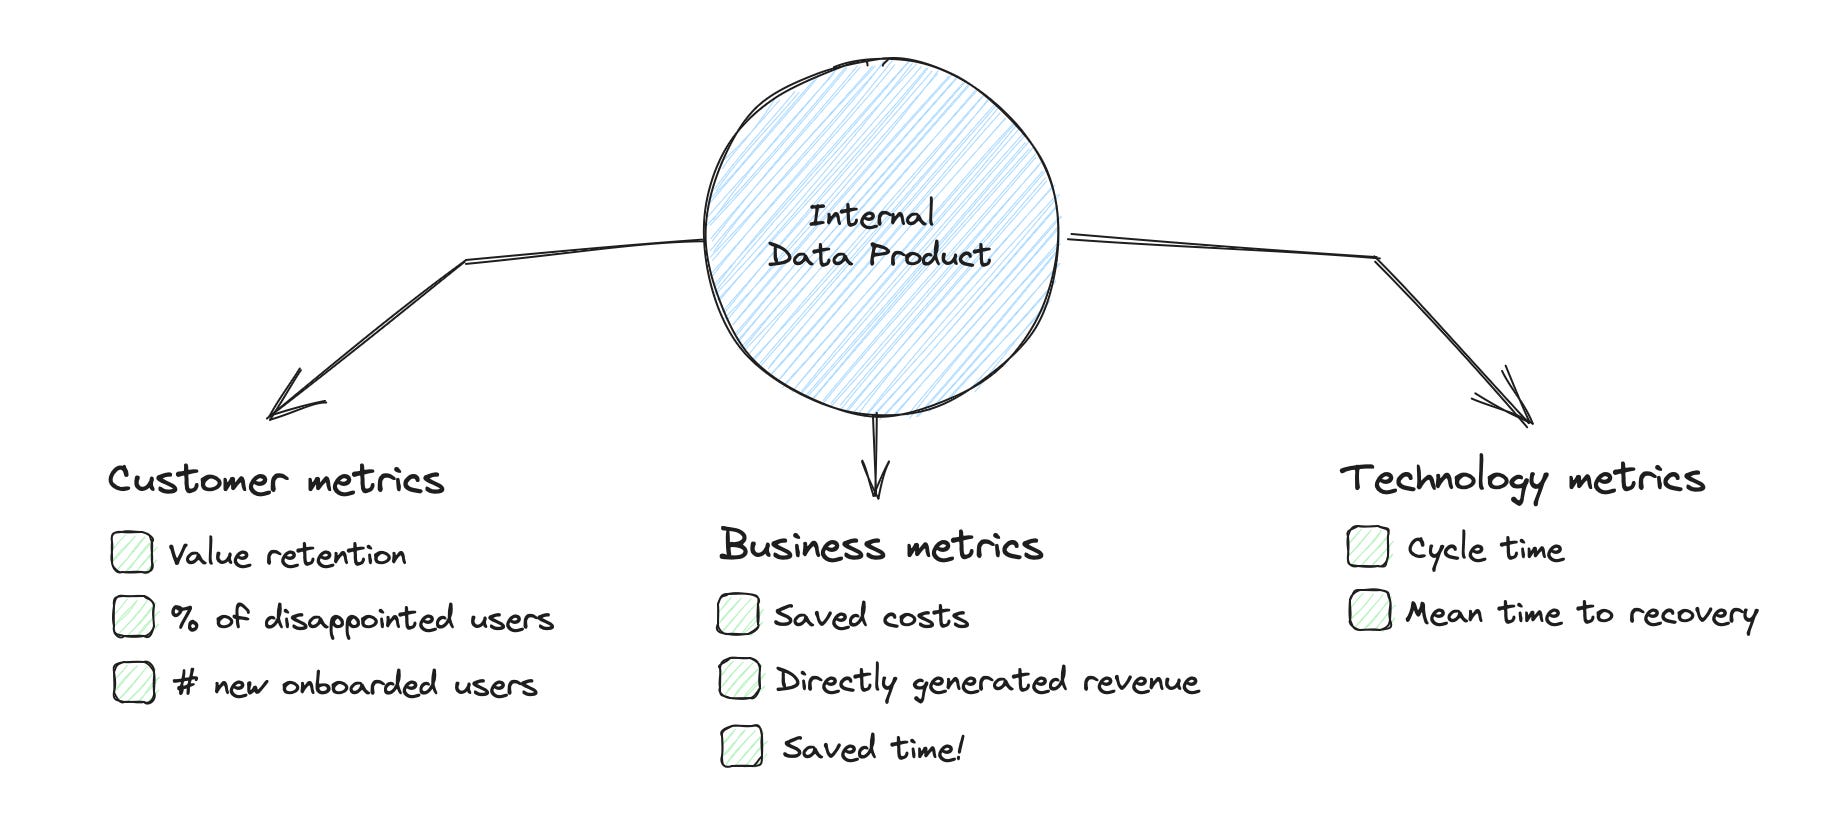
Another thing to set. When you ask ten people what a data product is for them, you can expect eight different answers spanning from an API, a model, to a Mac Desktop app. In this post, I will focus on internal data products. So what is it? I use this (my definition) definition for the next 2.000 words:

My favorite example is this: you can have a dashboard with a marketing campaign report showing core metrics for each campaign for the selected time frame. This is not a data product.
When you introduce 1-2 indicators for over and underperformance and 2-3 buttons to increase or decrease budget spending within the campaign data table - this is a first version of a data product because of the immediate action.

Another example is that a global marketing team oversees the marketing activities and rollouts in 30 local markets. The local teams do all the operations, and the international team is there to help with experience and standards but is also responsible for enforcing the standards. They use a simple alerting system based on operations, marketing, and sales data triggered by different severity levels. All alerts have immediate actions built-in (e.g., create a ticket with a click).
Enough of setting the scene - I hope you understand where we are going next.
The customers are internal teams for an internal product, and sometimes you start with one person. A completely different situation than an external product. But with plenty of opportunities.
Even a small target group can apply the same measures we use in external products. We need to understand these aspects of our customers to build a customer-centric solution:
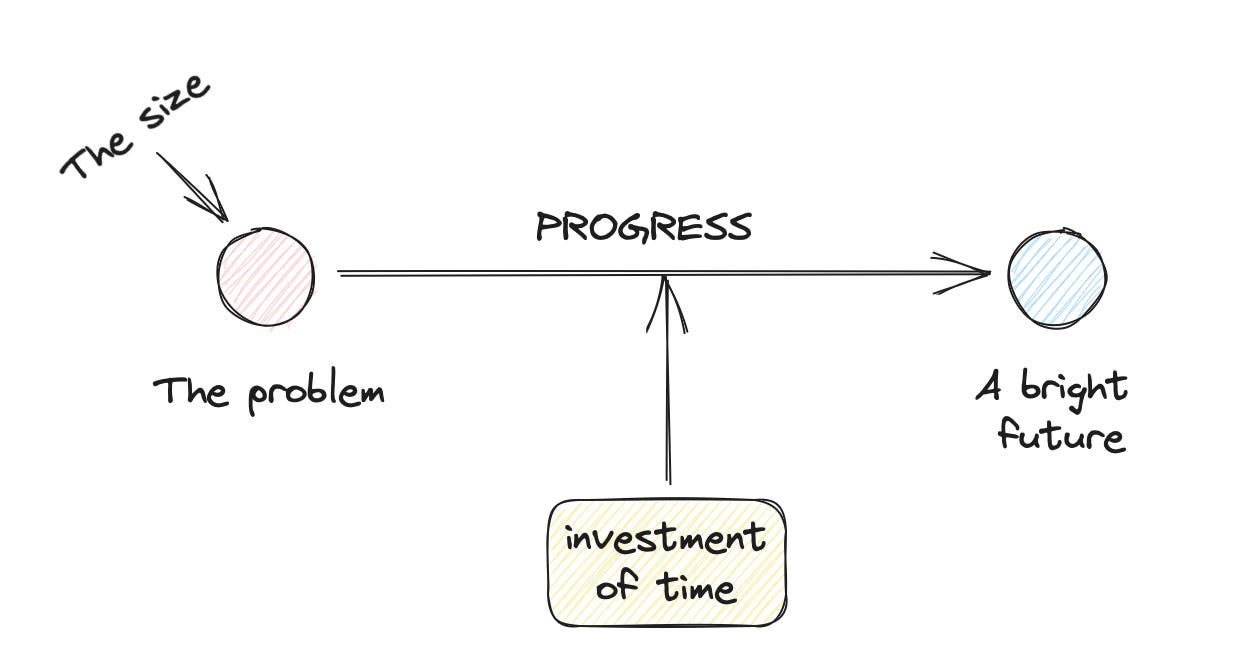
Each problem has internal and external factors. The external ones are things our customers can't or can only hardly influence, like reporting for specific public services or investors. When you interview your customers, it is important to identify these external factors and make them transparent. You can never build a solution to change these. They are untouchable territory.
The internal factors are things your customer can control - like providing an early version of an investor report to have enough time for adaptation and changes. These are the candidates you can solve with a data product.
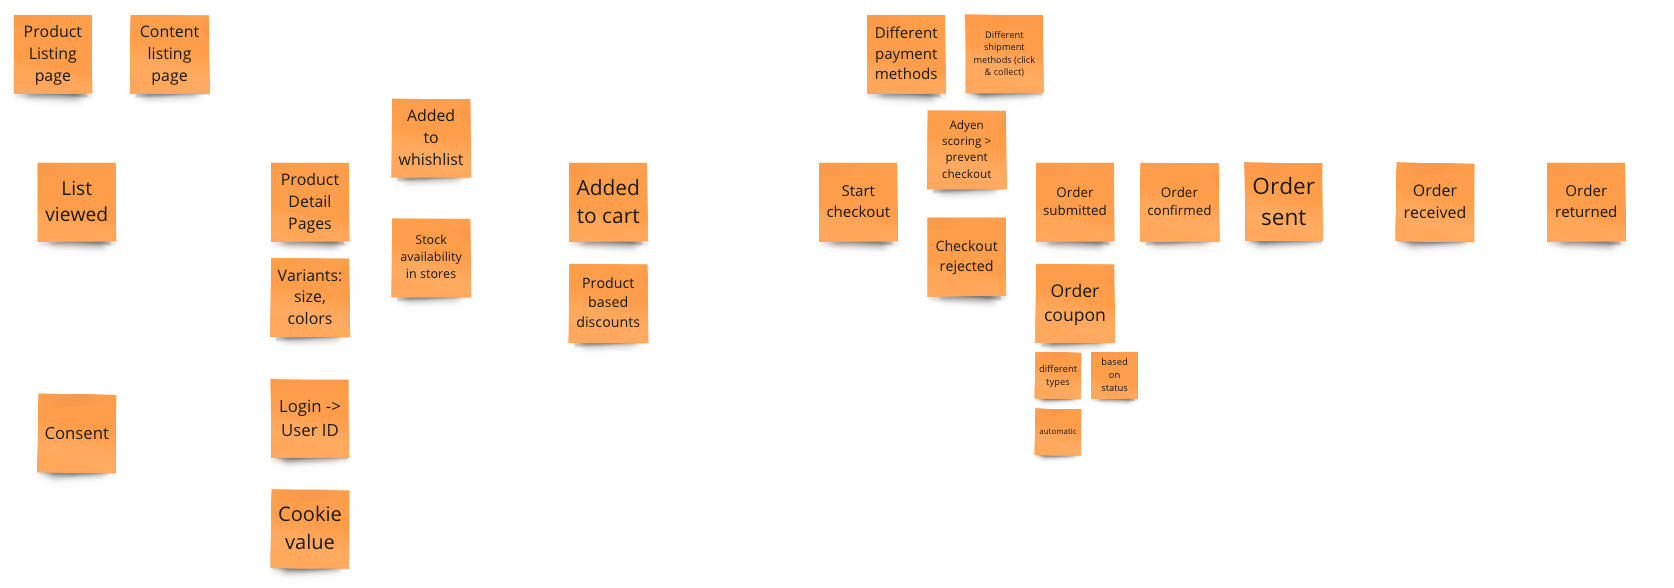
I usually use two approaches to identify these factors: Event storming and JTBD interviews. I did a 60m free course on how to use event storming for data setups.
Both are quite similar, so I usually run a combination of both. Ultimately, it is mapping out a process on a timeline, understanding the actions and people involved, and emotional and social challenges.
The result is a process map on a timeline with clusters of actions and problems.
Metrics:
For internal products, event data is not helpful, but you can use 1-2 events to get a simple "we are using it" signal like a successful authentication. This can give you a monthly retention rate (how many users return after 1,2,3,… months). Or a minimal monthly active user metric.
Better is proper product-market fit metrics. Not the NPS (problems with NPS). I like the PMF survey that Superhuman is using. Here you can optimize for the share of very disappointed users.
Let's be clear, you don't develop a new product, and people magically use it every day. Sometimes it works like this when you solve something that is deeply needed. But people must invest time learning the new products in all other cases. And this process is also in your hand; when you invest time to teach people and learn about their usage, the better the adoption will be.
Metrics:
Let's start with something simple: The number of new onboarded users (and their retention rates).
This is more important for the ideation phase. Before you dive into developing something, just because you understood the problem, the internal function, and 1-2 real good ideas, doesn't mean that this effort has an impact. You can read about the next dimension, where we look at the business.
This one is quite interesting in the context of an internal data product since you might not charge the other teams to use your data product (I know accounting and controlling can have weird ways, but let's assume not). But this dimension is still interesting for us.

I already mentioned it when writing about the severity of the problem that you will solve with a data product. We could also call it business impact, which gives us the business angle.
But the business impact makes it challenging to start with. How to define and measure business impact? There are books written about it. Let's start with something in the context and more simple. It is taking the two forces of a business: Revenue or Cash Flow and Cost Savings. An internal data product can have an impact on one of them. An internal A/B testing product impacts the revenue, not a direct one, but one. This could be an automation that pauses or adapts online campaign budgets based on stock levels to reduce costs directly.
If this is not possible to connect, you can still go for time saved. When a team has a task that takes them 15h a month - like preparing an investor's report and your internal product is reducing this time by ten hours. You achieve a significant time saving for a year of 120h. That gives you some budget to develop it. Let's say you can create it in 40h - this would be a 3x return on time.
This also helps you to get an idea of how much investment makes sense to build.
Metrics:
This dimension sounds easier at first glance but is the hardest to measure. How do you measure a product technology? You can measure technical consumption, like how many API requests have been served. But it doesn't tell us something.
It is the same question as how to measure a data team's performance and output. Also not that easy. What is the number of tickets resolved? Not really a good measure.
I like to use metrics derived from DevOps since they tell us something about how operational a team is working. It gives us indicators if a team needs help with architecture or workload.
In the book, Accelerate: The Science of Lean Software and DevOps: Building and Scaling High Performing Technology Organizations, Dr Nicole Forsgren, Jez Humble, and Gene Kim have analyzed strong-performing technology organizations and what sets them apart. And based on that, they came up with four core metrics:
The Metrics:
If you are starting, use cycle time and mean time to recover as a start.
Even when the metrics for internal products are not obvious, and we might say: we just build it but can't measure it, the post should show you that there are metrics that can help you. And most of them are quite easy to implement.
The three dimensions of a product are essential. If your product has great technology and even solves a customer (internal team) problem, it can still be extremely irrelevant to the business. So please make sure you cover them all.
And metrics are great to put into a quarterly or annual presentation where you show your team's work. I can tell you these slides look a lot better with stats like these:
I would love these slides. If you do, too, start to get some metrics!


.jpg)


