


TABLE OF CONTENT
TOC
Concept: Quenching the perpetual business curiosity
Tech: Collection of Model-First Data Products
1. 💡 The Metric Dependency Tree
2. 💠 The Model-First Data Product(s)
Step 1: Retrieving Requirements
Step 2: Modeling the Product Prototype
Step 3: Validating the Prototype
Step 4: Materialising Product from Prototype
Say, as a sales manager, I get all my data reports from my sales analysts, which answer my key questions and allow me to draw my own insights. What would data products do differently for me, and why should I champion them or encourage sales exes to consider them at all?
The same stands true for other domains. Be it Marketing, Ops, or HR, you have teams of marketing analysts, business analysts, and even HR analysts. How are data products changing, most importantly, the domain’s or team’s contribution to business and, secondly, the teams' experience of data?
We can share an uninspiring listicle of all the advantages of productised data, or we can show you.
Almost a year ago, we shared the Data Product Strategy (synopsis) and found great resonance in the community for the metrics-first approach, which led us from the ideation of key metrics that drive businesses to the evolution of the same metrics for better alignment and value. Let’s do a walkthrough with some representative examples to see how the above journey plays out.
Business Never Stops Asking Questions
Let’s go back to the sales manager we started this story with. In addition to all the generic sales questions with set pipelines, there are questions that require data mergers across domains and novel questions that require speedy answers instead of the loopy and long-winded process of setting up new data pipelines.
Often, a new pipeline is necessary to answer a single question, which puts a lot of pressure on analytics engineers who have to manage the build and continuity of an overwhelming quantity of complex data pipelines while not being able to serve business with satisfactory speed and value.
How to Quench the Business Curiosity
As decreed by the Gods of Productisation, Always Start with Users
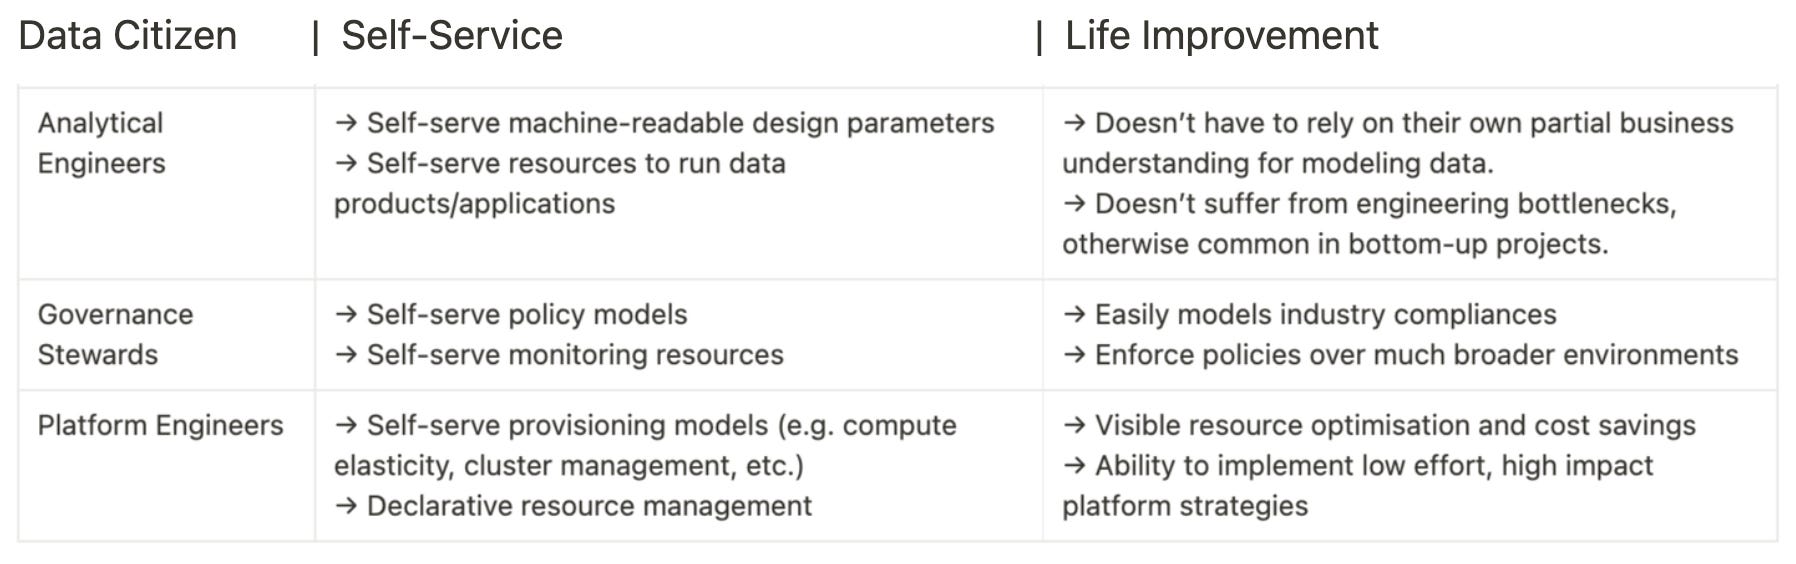
Every domain is looking to work with data for better decision-making. To make a data product strategy truly successful, we need to find out and pin down the following from domain teams and experts:
- Key business goals of the different functions: these are the north star goals of the business (e.g., revenue, ARR) and the north star goals of different functions that enable these organisational metrics.
- Questions that domains want answered: these are primary questions aligned to reaching closer to the business goals. While such questions are definitely not exhaustive, some core queries are necessary to get started on the data product. The objective is to build a product that can tend to novel queries at the speed of the business.
- Dependencies between metrics: these are a list of North Star metrics, granular metrics, and associations between them. Again, to get started, one doesn’t need an exhaustive list, only some foundational core metrics to get started. The objective is to discover and add new, evolved, and more business-aligned metrics through the data product.
Below is an example of questions to be answered in the context of sales and marketing alignment. Notice the art of possible here. These answers require sales analysts to understand both marketing and sales data (a complex undertaking). These questions could be revolutionary for the sales cycle and cut down the cycle significantly through a much clearer understanding of prospect profiles.
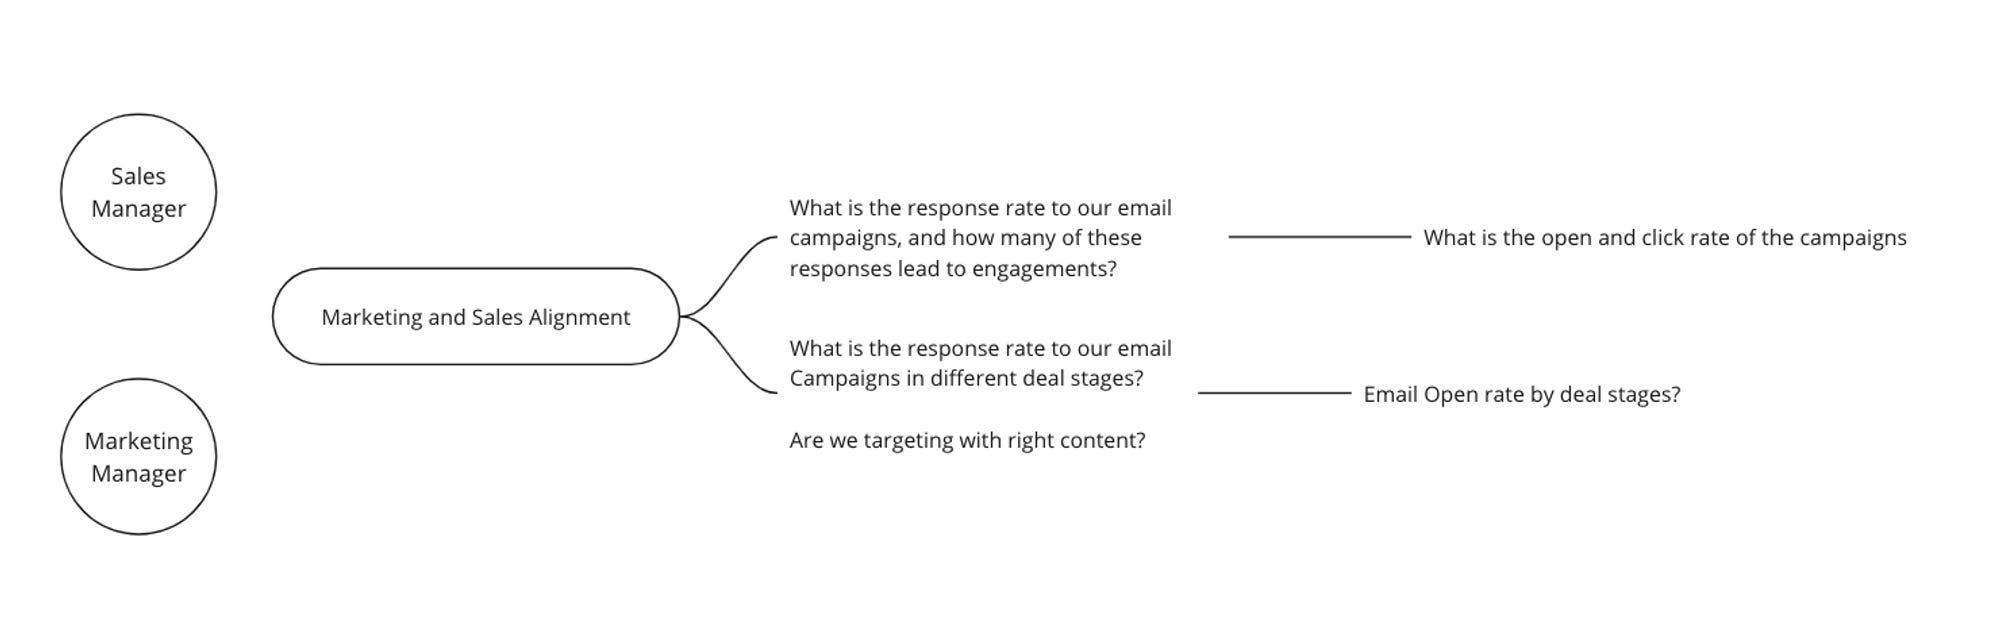
- Business Purpose: Understand the effectiveness of email communication strategies throughout the sales pipeline.
- Decision: Tailor content aligned to the different deal stages to improve the Open Rate, Conversion Rate, and more.
- Metrics: Email Open rate, CTR by deal stages, Campaign success rate, and more.
The above data product built for the given Purpose would be able to:
- Easily cater to novel questions that involve mergers between marketing campaigns and sales tables. Building new pipelines is not necessary; analysts can instead build new queryable views within minutes and even add more data to the mix if necessary.
- Consistently understand the pulse of the metrics and trace back to deep-seated opportunities and risks that are either fuelling the metrics or pulling them down.
- Uncover and highlight the potential for evolved or new metrics that help achieve more business value (as a result of being consistently user-facing and leveraging usage analytics).
The Tech: A Collection of Model-First Data Products
Mantra: Model data requirements for a productised outcome.
This essentially means modeling the outcome first (prototyping) and then putting the parts together to bring the product vision to life.
Modeling user requirements as a first step bridges the gap between data and business goals. By being model-first, you are essentially enabling all data applications and pipelines to become user-facing consistently. ‘Consistently’ being the key word.
Unlike traditional modeling, domains are directly involved in the modeling phase, instead of having to iterate with a centralised engineering team. This is why traditional modeling often lacks business context around changing user requirements or lacks sufficient control/flexibility.
What is “Model” in this context?
The first step, as mentioned above, is to always start with users and collect their requirements and goals. Based on this information from different domains, a Data Product Manager (or similar, like analytics or product manager) condenses the information into logical model(s) which materialise in the form of:
- A Metric Dependency Tree (MDT)
- Prototype(s) of the data product(s) that powers the Metric Dependency Tree
The Metric Dependency Tree
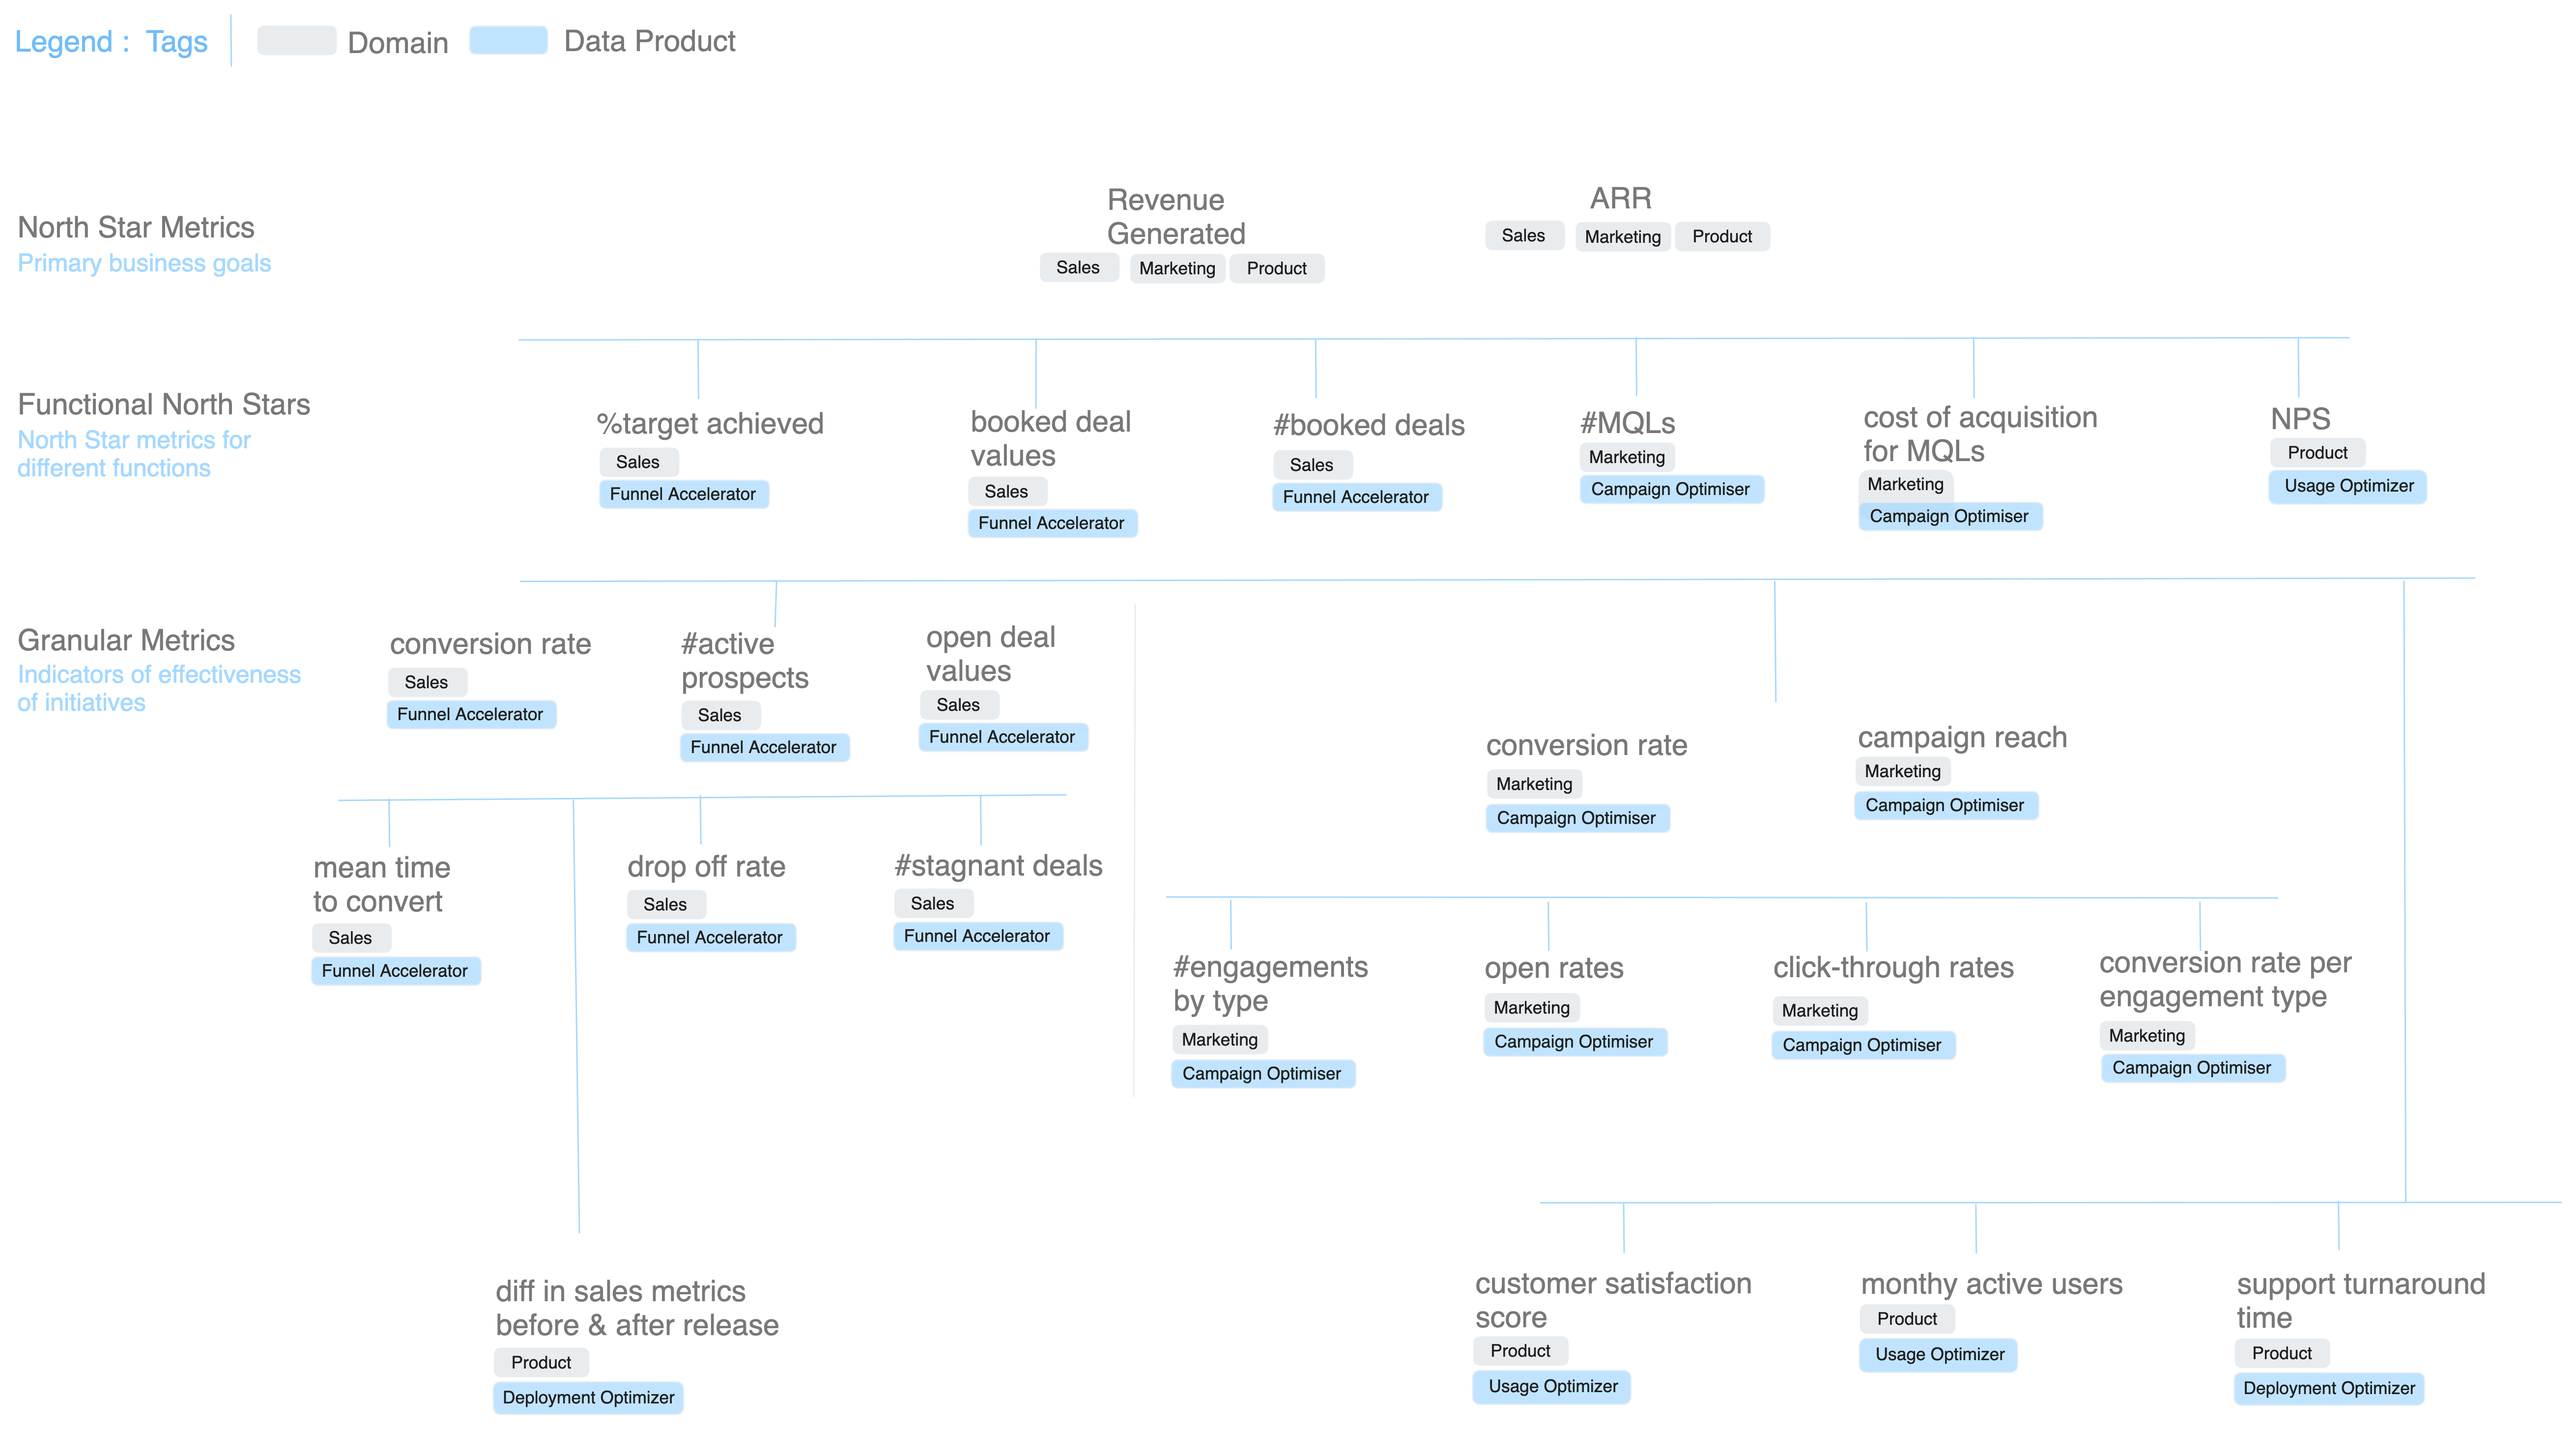
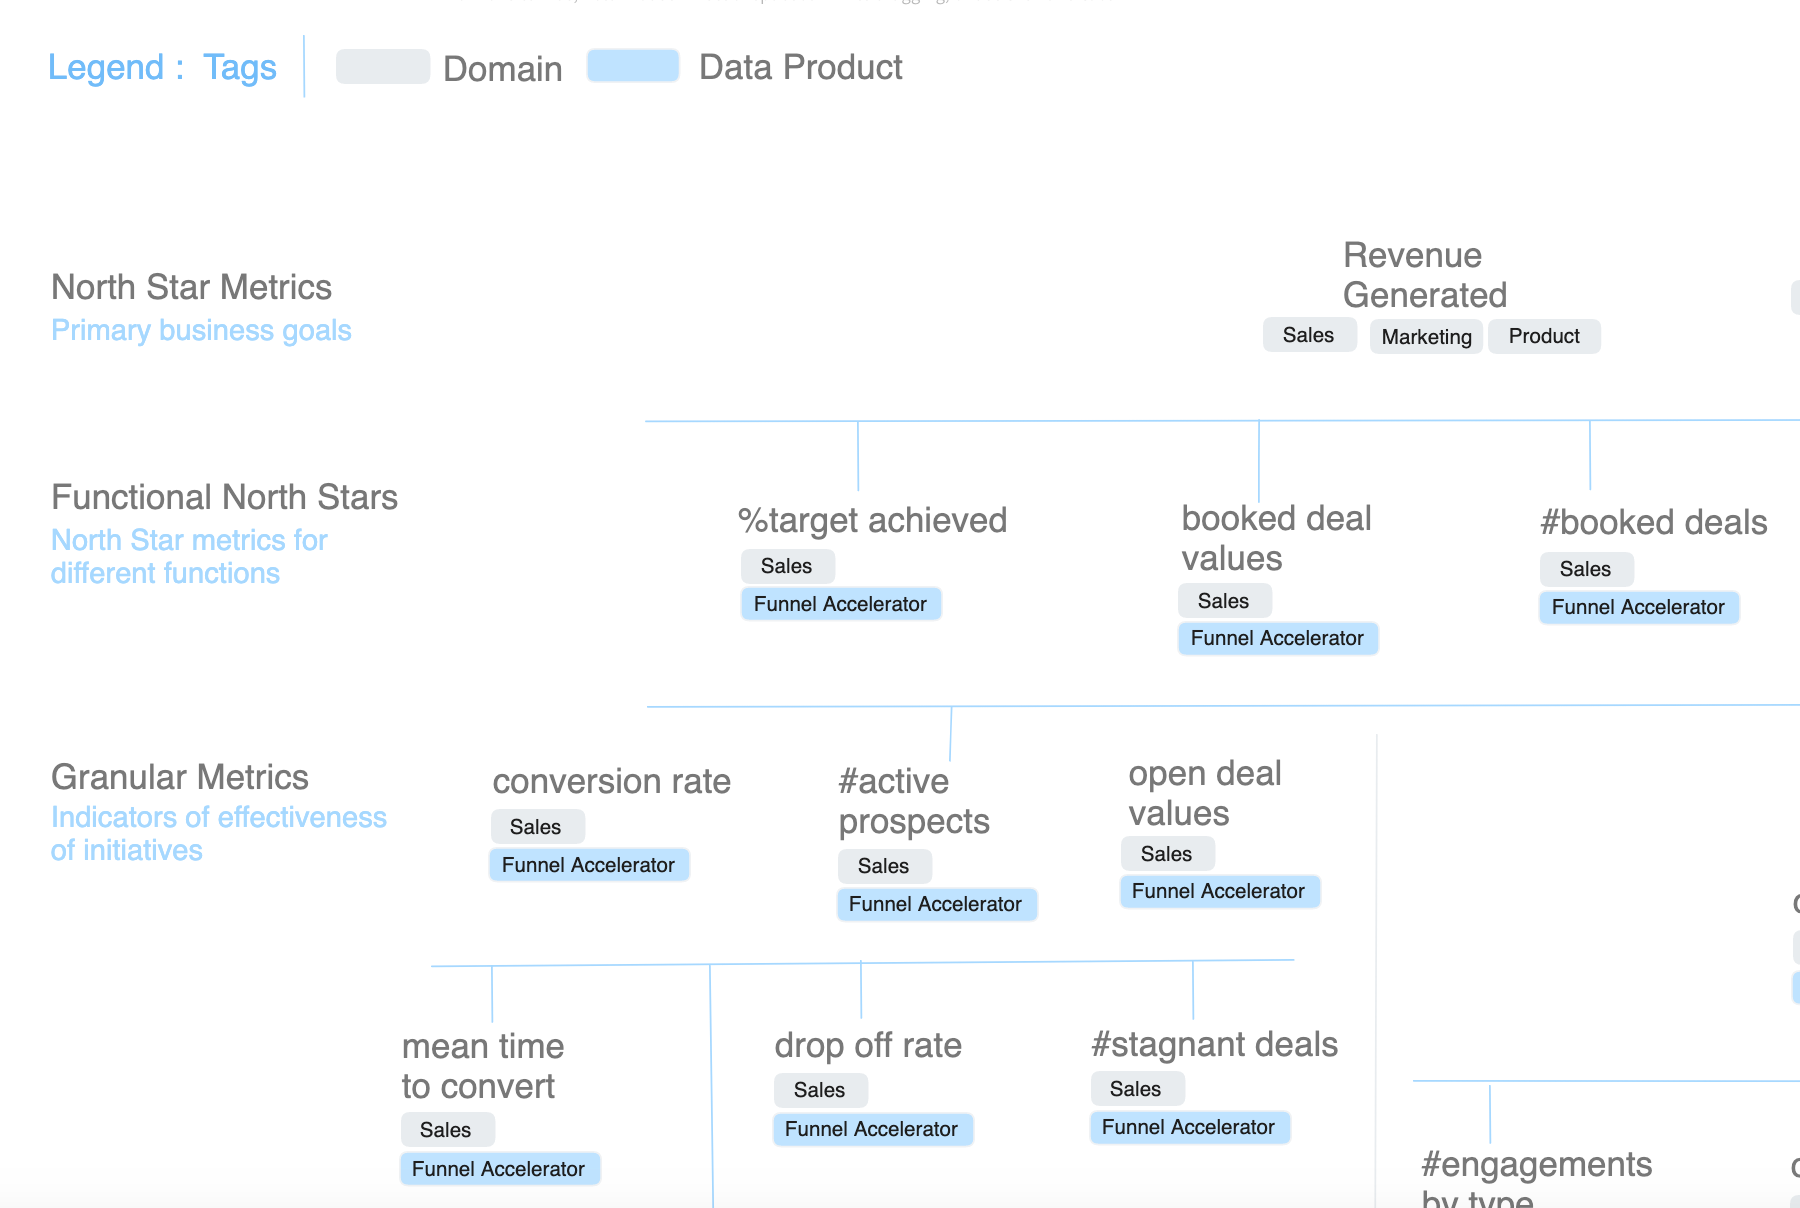
In the illustrated example, we’ve shown a metric dependency tree for Enterprise Ops. This would typically come together with a “mesh” of data products powering the metrics layer. However, metrics trees don’t have to be global. They could also be local to the use case, say, a metric tree for “sales funnel acceleration”.
The objective of the metrics dependency tree is to understand what positively or negatively triggers the targeted metrics and then aid informed actions to pump the metrics as required. In other words, the metrics dependency tree is a brilliant way to instantly find the root causes (RCA) behind business fluctuations and solve them just as quickly. The metric tree also sheds light on the potential of new or enhanced metrics (metric evolution).
If you wish to learn more about metric trees, here are two quick refreshers:
More on metric trees/models: Data Product StrategyImpact of metric trees on a CXO's life
Instead of being technical like the above reads, let’s understand the value of the MDT through the example of the sales manager. The sales manager observes that the curve has flattened for the ******metric on the %target achieved. He immediately looks at the granular metrics enabling this north star metric, which are, say, the conversion rate at every stage, #active prospects, and avg. open deal values.
He notices that the conversion rate has gone down and looks at the granular metrics that impact the conversion rate - avg time per stage, mean time to convert, drop-off rate, #stagnant deals. If the metric on avg time per stage is off, he would have direct insight into which sales stages are causing the trouble, and a deep-dive into further granular metrics would uncover, say, why and how that particular stage is suffering.
These insights are not just restricted to the sales domain but can fish data from other domains as well, such as product and marketing, to have a complete view of all impacting factors.
To improve the performance of North Star metrics, the sales manager could come up with new data strategies or enhanced granular metric(s) and convey the same strategy to sales analysts and the data product manager. Based on the new logic, the analyst could tweak the Sales Funnel Accelerator (Logical Model powering the sales funnel metrics) in the following ways:
- add, update, or delete new entities to the underlying data model (single-lined logical joins)
- define new logic (for metrics or data views) based on the updated requirement (logical queries)
Finally, the analytics engineer simply maps the physical data/tables as per the schema and logic of the new requirements in the logical model/prototype.
The Model-First Data Product(s)
Multiple data products power large-scale trees such as the one on Enterprise Ops Metrics (organisational north stars like Revenue and ARR as primary metrics). In our representative sample, we had data products from across domains, such as the Sales Funnel Accelerator, Marketing Campaign Optimiser, Product Usage Optimiser, and Deployment Optimiser.
However, for more local dependency trees, such as the sales slice, even one data product could be enough to run the show. We’ll sample the Sales Funnel Accelerator (SFA) to demonstrate the model-first approach to building data products.
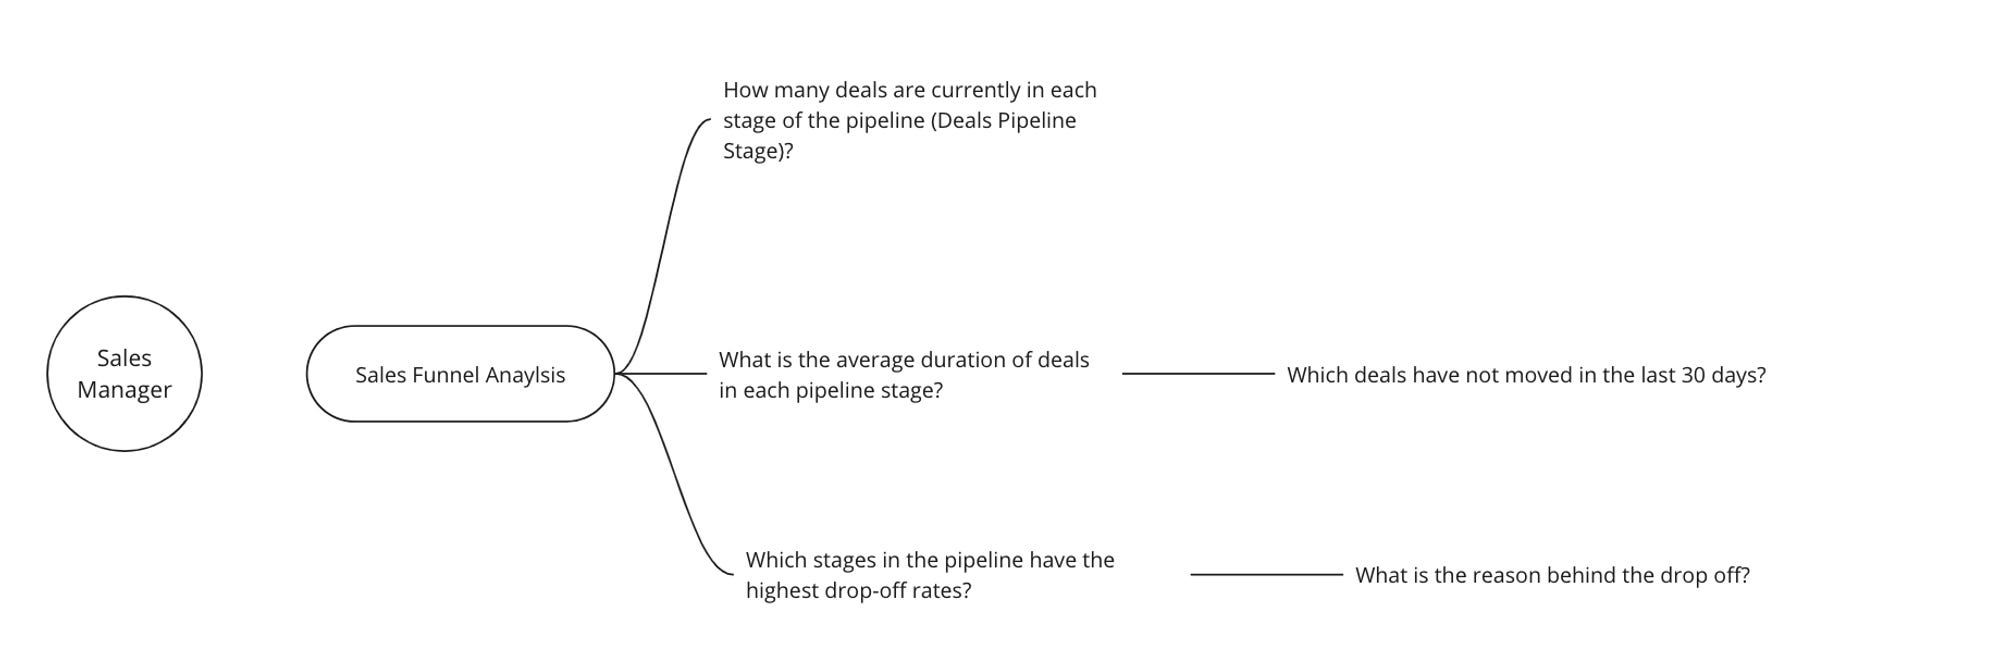
Step 1: Explore the End User’s Curiosity and Drive
Retrieve requirements from end users of the Funnel Accelerator. Closely interview a bunch of end users and really strive to understand their pain points. The raw requirements could look like a simple list of questions or even a chart of associated questions (example below):
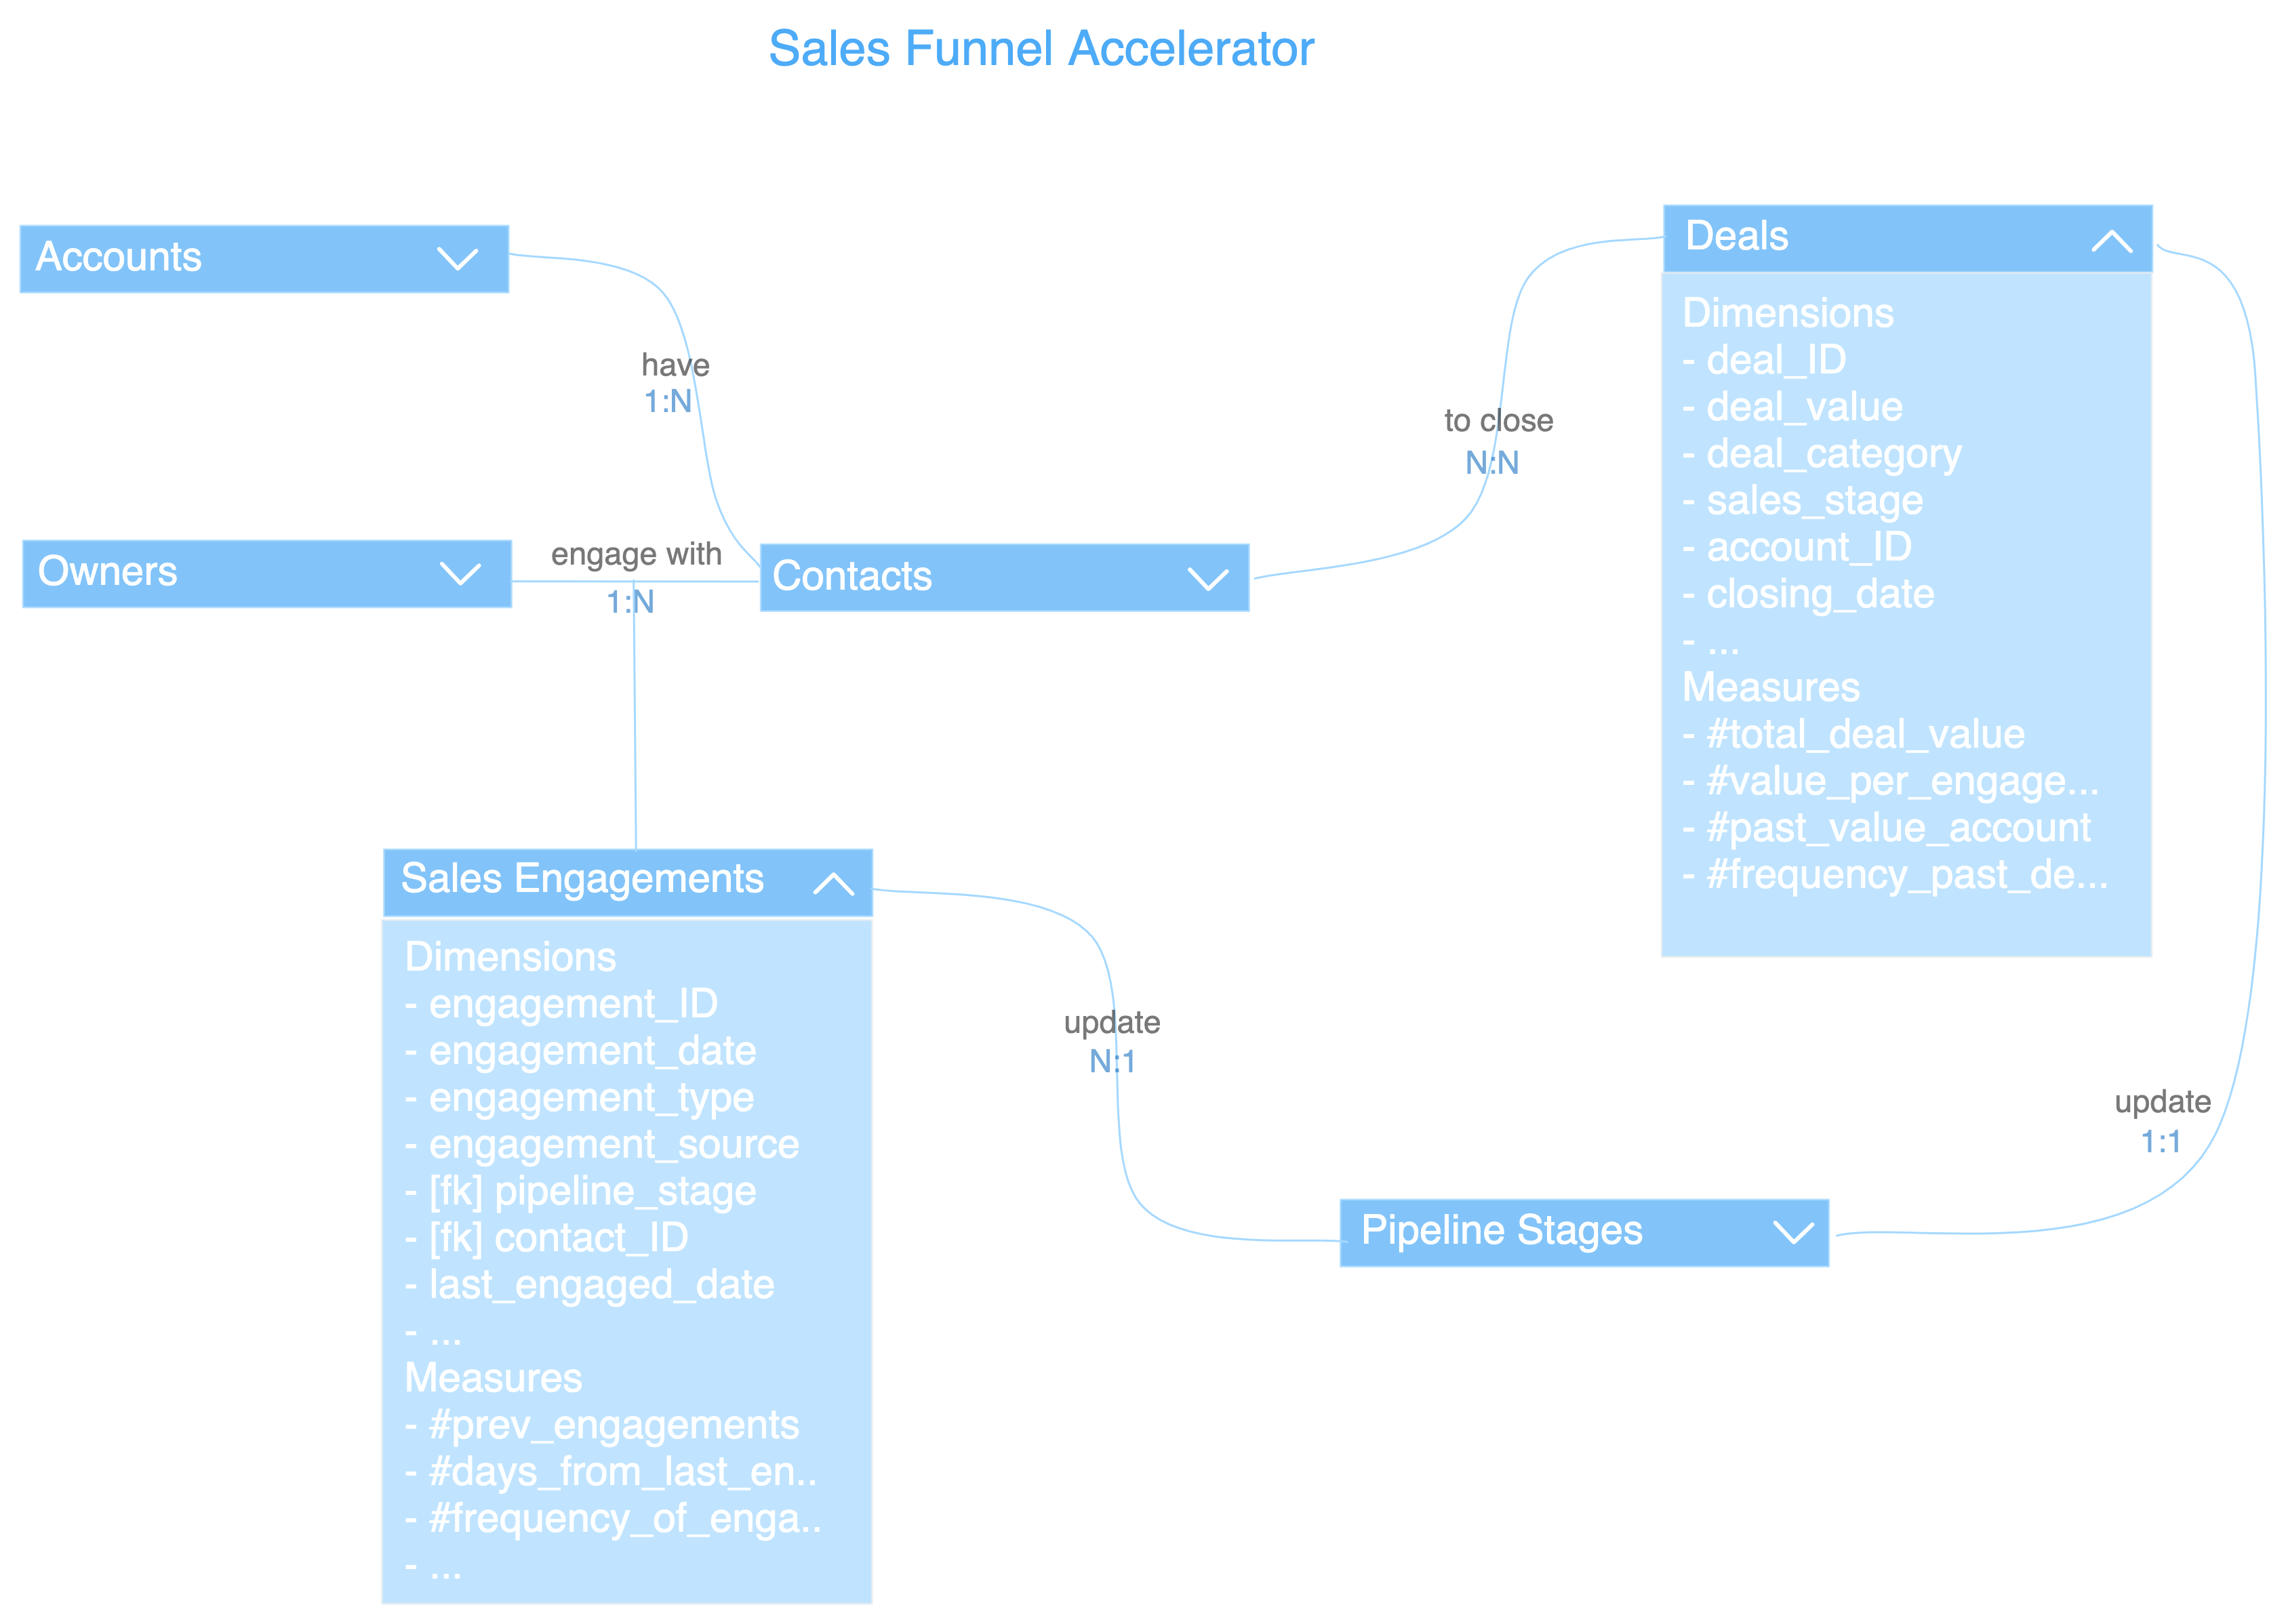
Step 2: Creating the Product Prototype
Figure out the entities/tables which deliver the data to answer the above questions. Weave these entities with the data outcome in mind to build a logical model or a Data Product Prototype. In the case of the Funnel Accelerator, we have logically identified entities and defined relationships as follows:
- Target Accounts have one or more Contacts
- Account Owners engage with one or more Contacts to close one or more Deals
- The Engagements are recorded in a store which updates the Sales Pipeline Stages
- The Pipeline Stage accordingly updates the booking status of the Deals
Each entity is further given more character with required dimensions/columns, measures/calculations, and key relationships. A relatable example could be the sales industry standards, which decrees some standard dimensions against standard entities such as Contacts and Customers, which are stored in CRMs like HubSpot. Domain experts often stick to the lingo while defining these standard dimensions alongside novel ones.
This story, as complex as it may get over time, manifests into a readable logical model with no dependency on the limitations of physical data sources (we’ll come to that in a bit). The only dependency, as it should be, is the user requirements for which the product is being built. In more technical terms, it shifts the control of data initiatives and outcomes closer to the business (shift-left in ownership).
Step 3: Prototype Validation
Once the prototype is drafted as above, it’s critical to validate if the connections, keys, and overall model actually work when data starts flowing through its veins. Plugging in the physical data sources is a fatal blunder at this stage.
It would unnecessarily loop in the analytics engineer and get them stuck in frustrating iterations of data mapping every time a flaw is discovered in the prototype. Exploring and discovering data and then transforming it for the right mapping is a longer process and, therefore, inefficient unless the prototype is declared a working model.
This calls for sophisticated mock data as a service. In one of our internal surveys on analytics engineers, we found that generating data for testing was surprisingly challenging, given the intricacies and patterns of different domain data on which insight-generating pipelines depend like a stack of dominoes.
This is why mock or synthetic data needs to imitate closely the original data that will be plugged into the prototype (say, CRM data from industry ‘x’). For instance, the Accounts and Contacts data should simulate the 1:N relationship or foreign keys and primary keys should be populated in sync, etc.
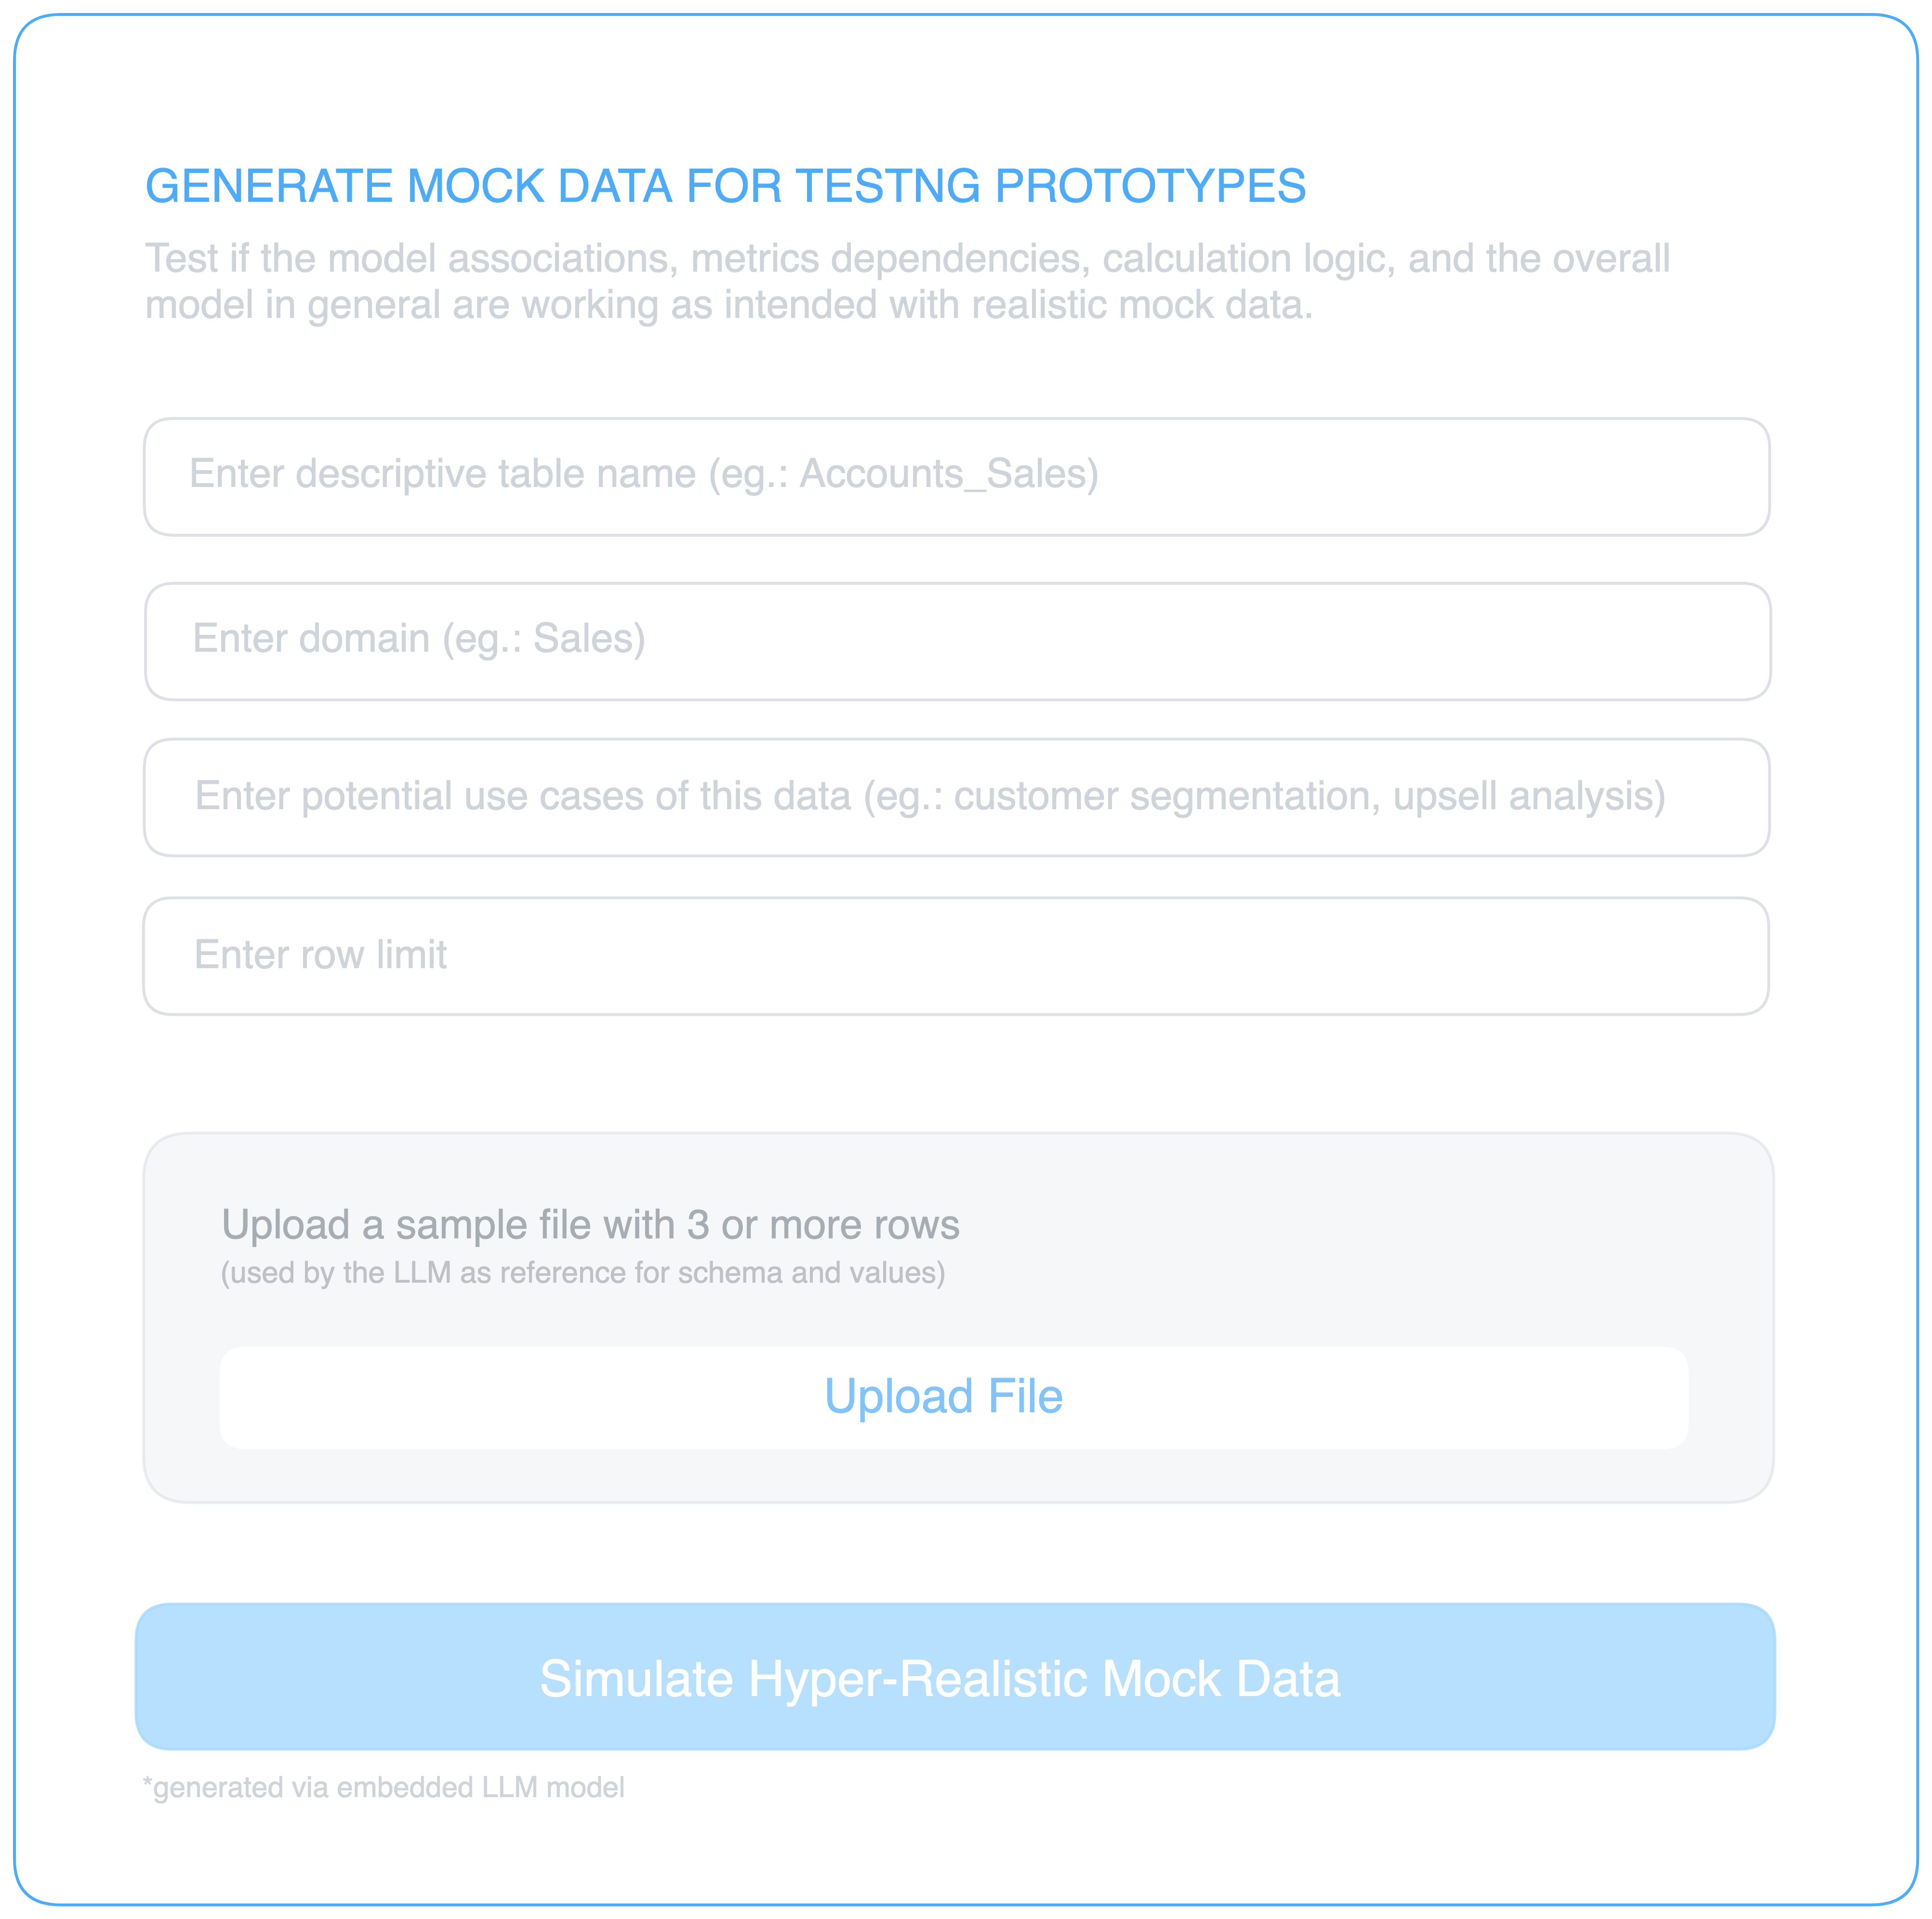
Given the advent of advanced AI during the last couple of years, realistic mock data for testing purposes is no longer a frustrating rule-based and iterative cycle. We’ll not go into the details behind such AI algorithms in the scope of this piece.
Step 4: Materialising Product from Prototype
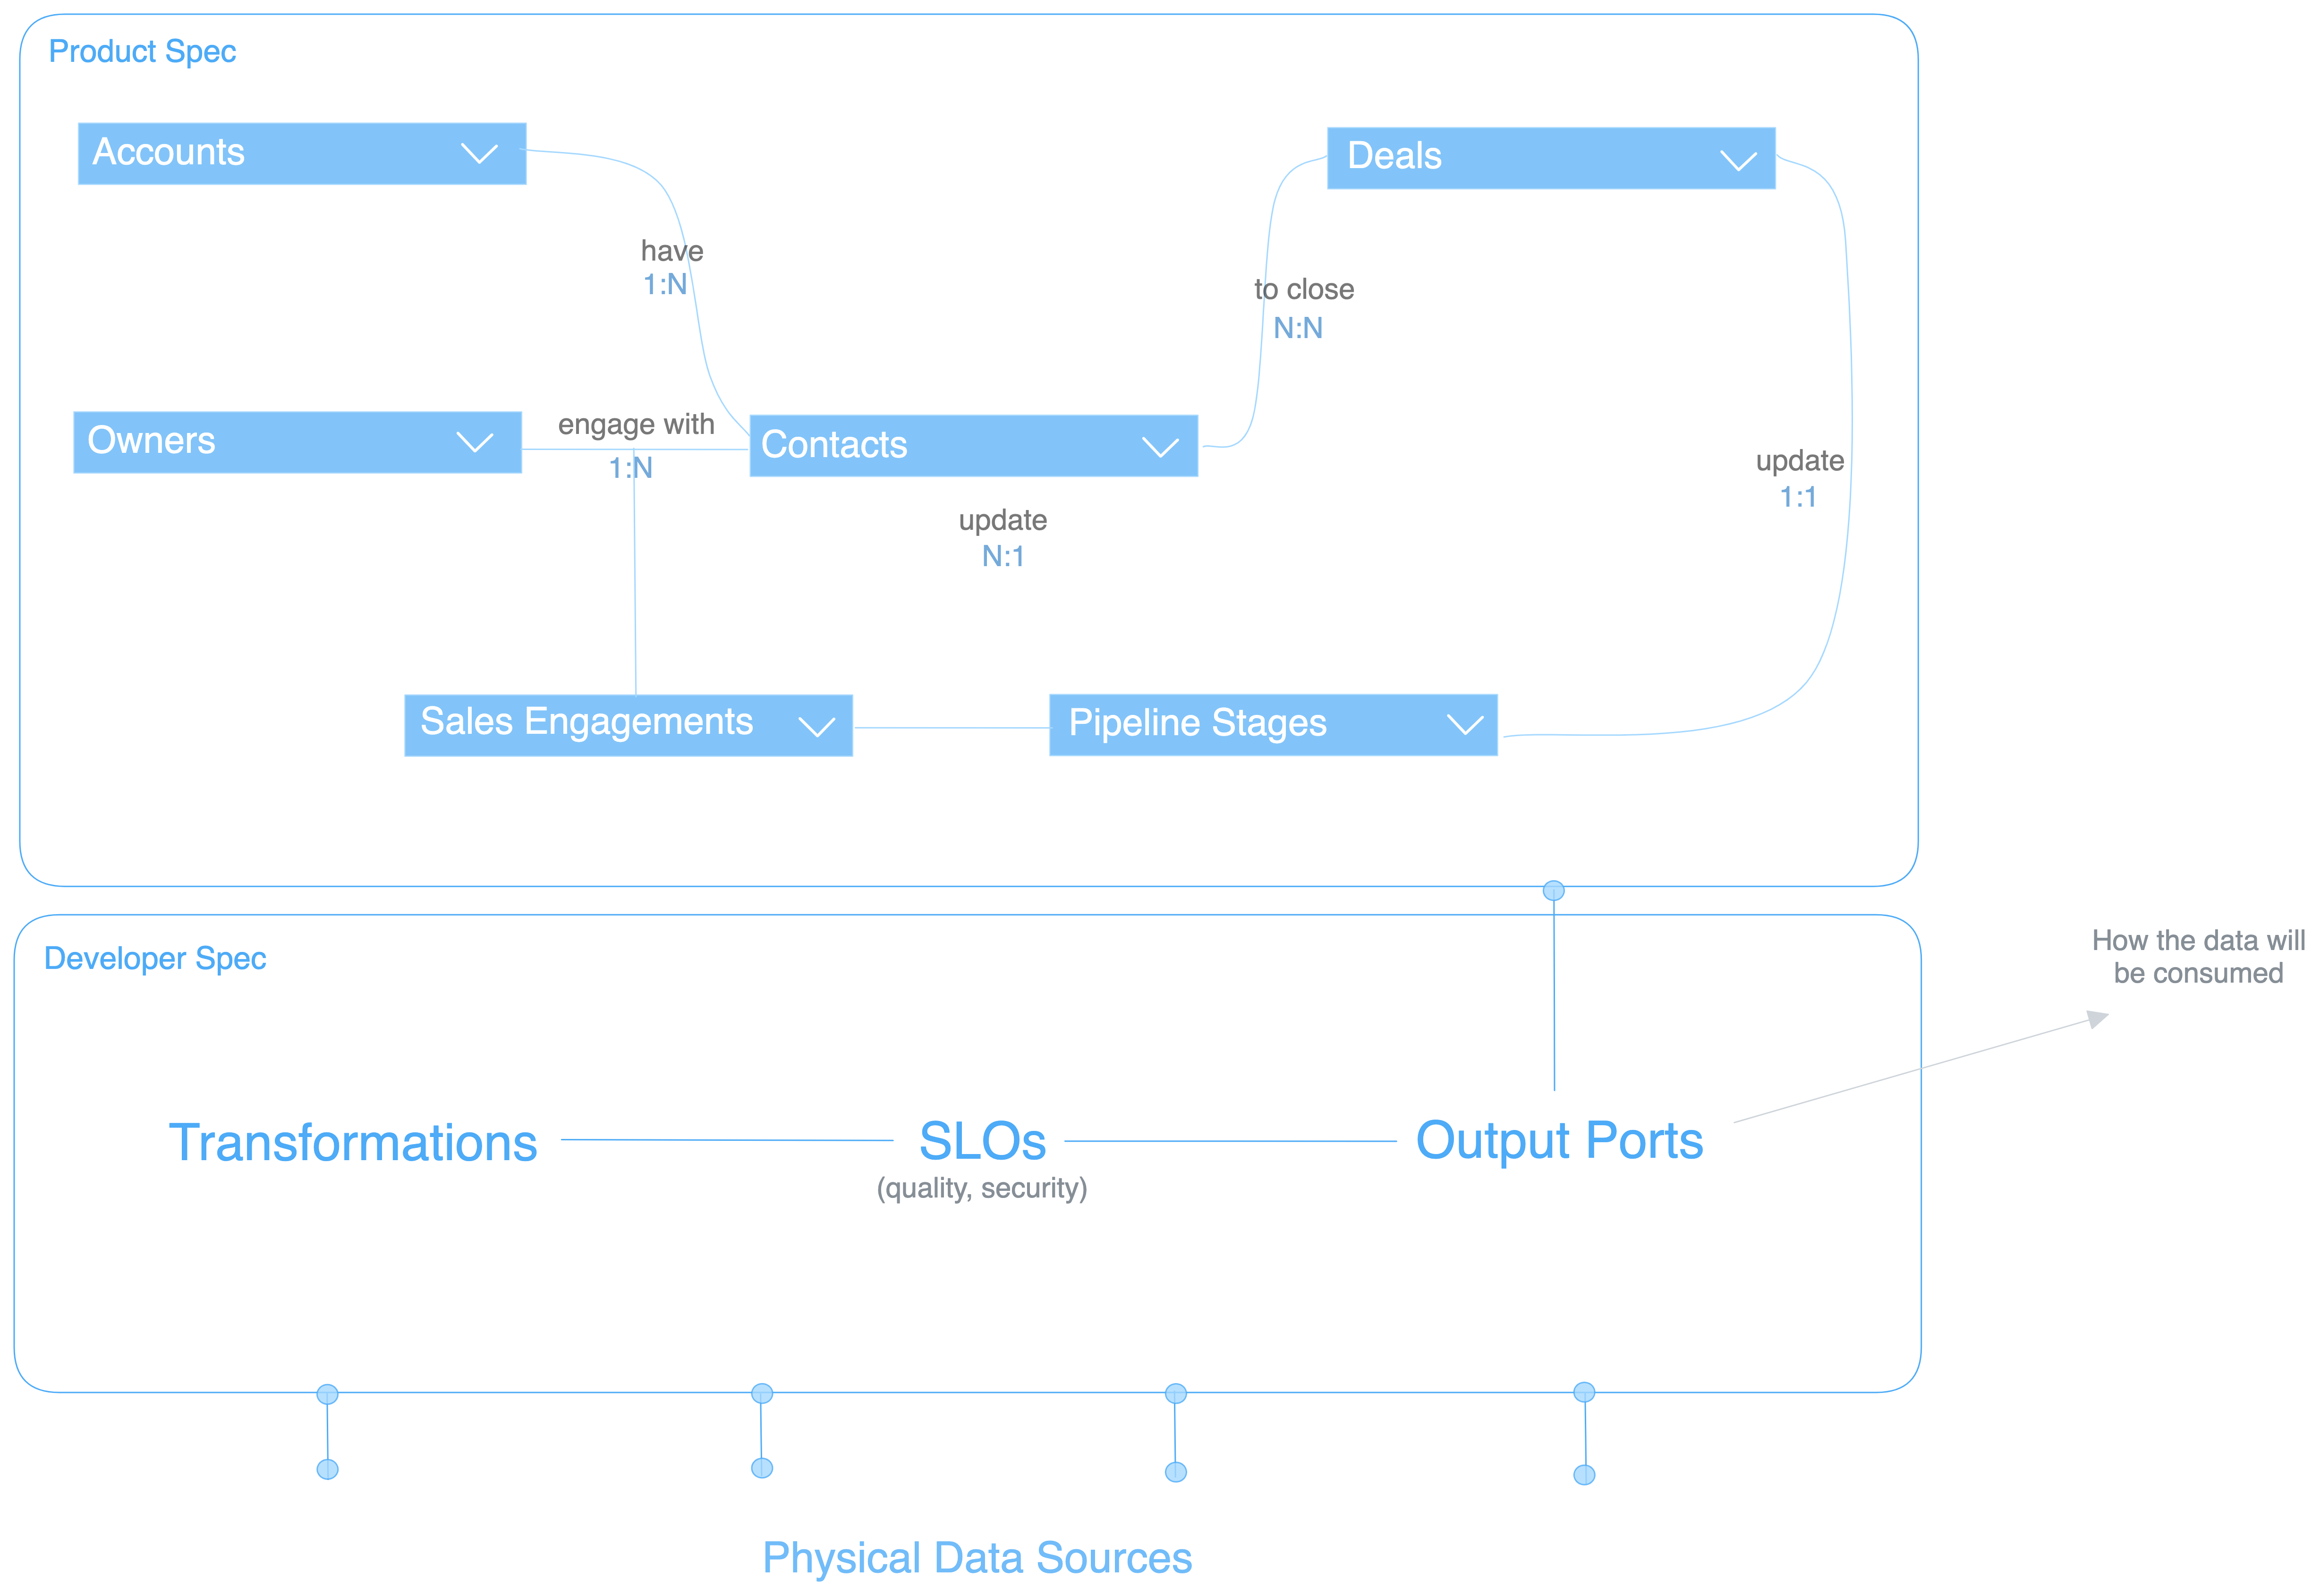
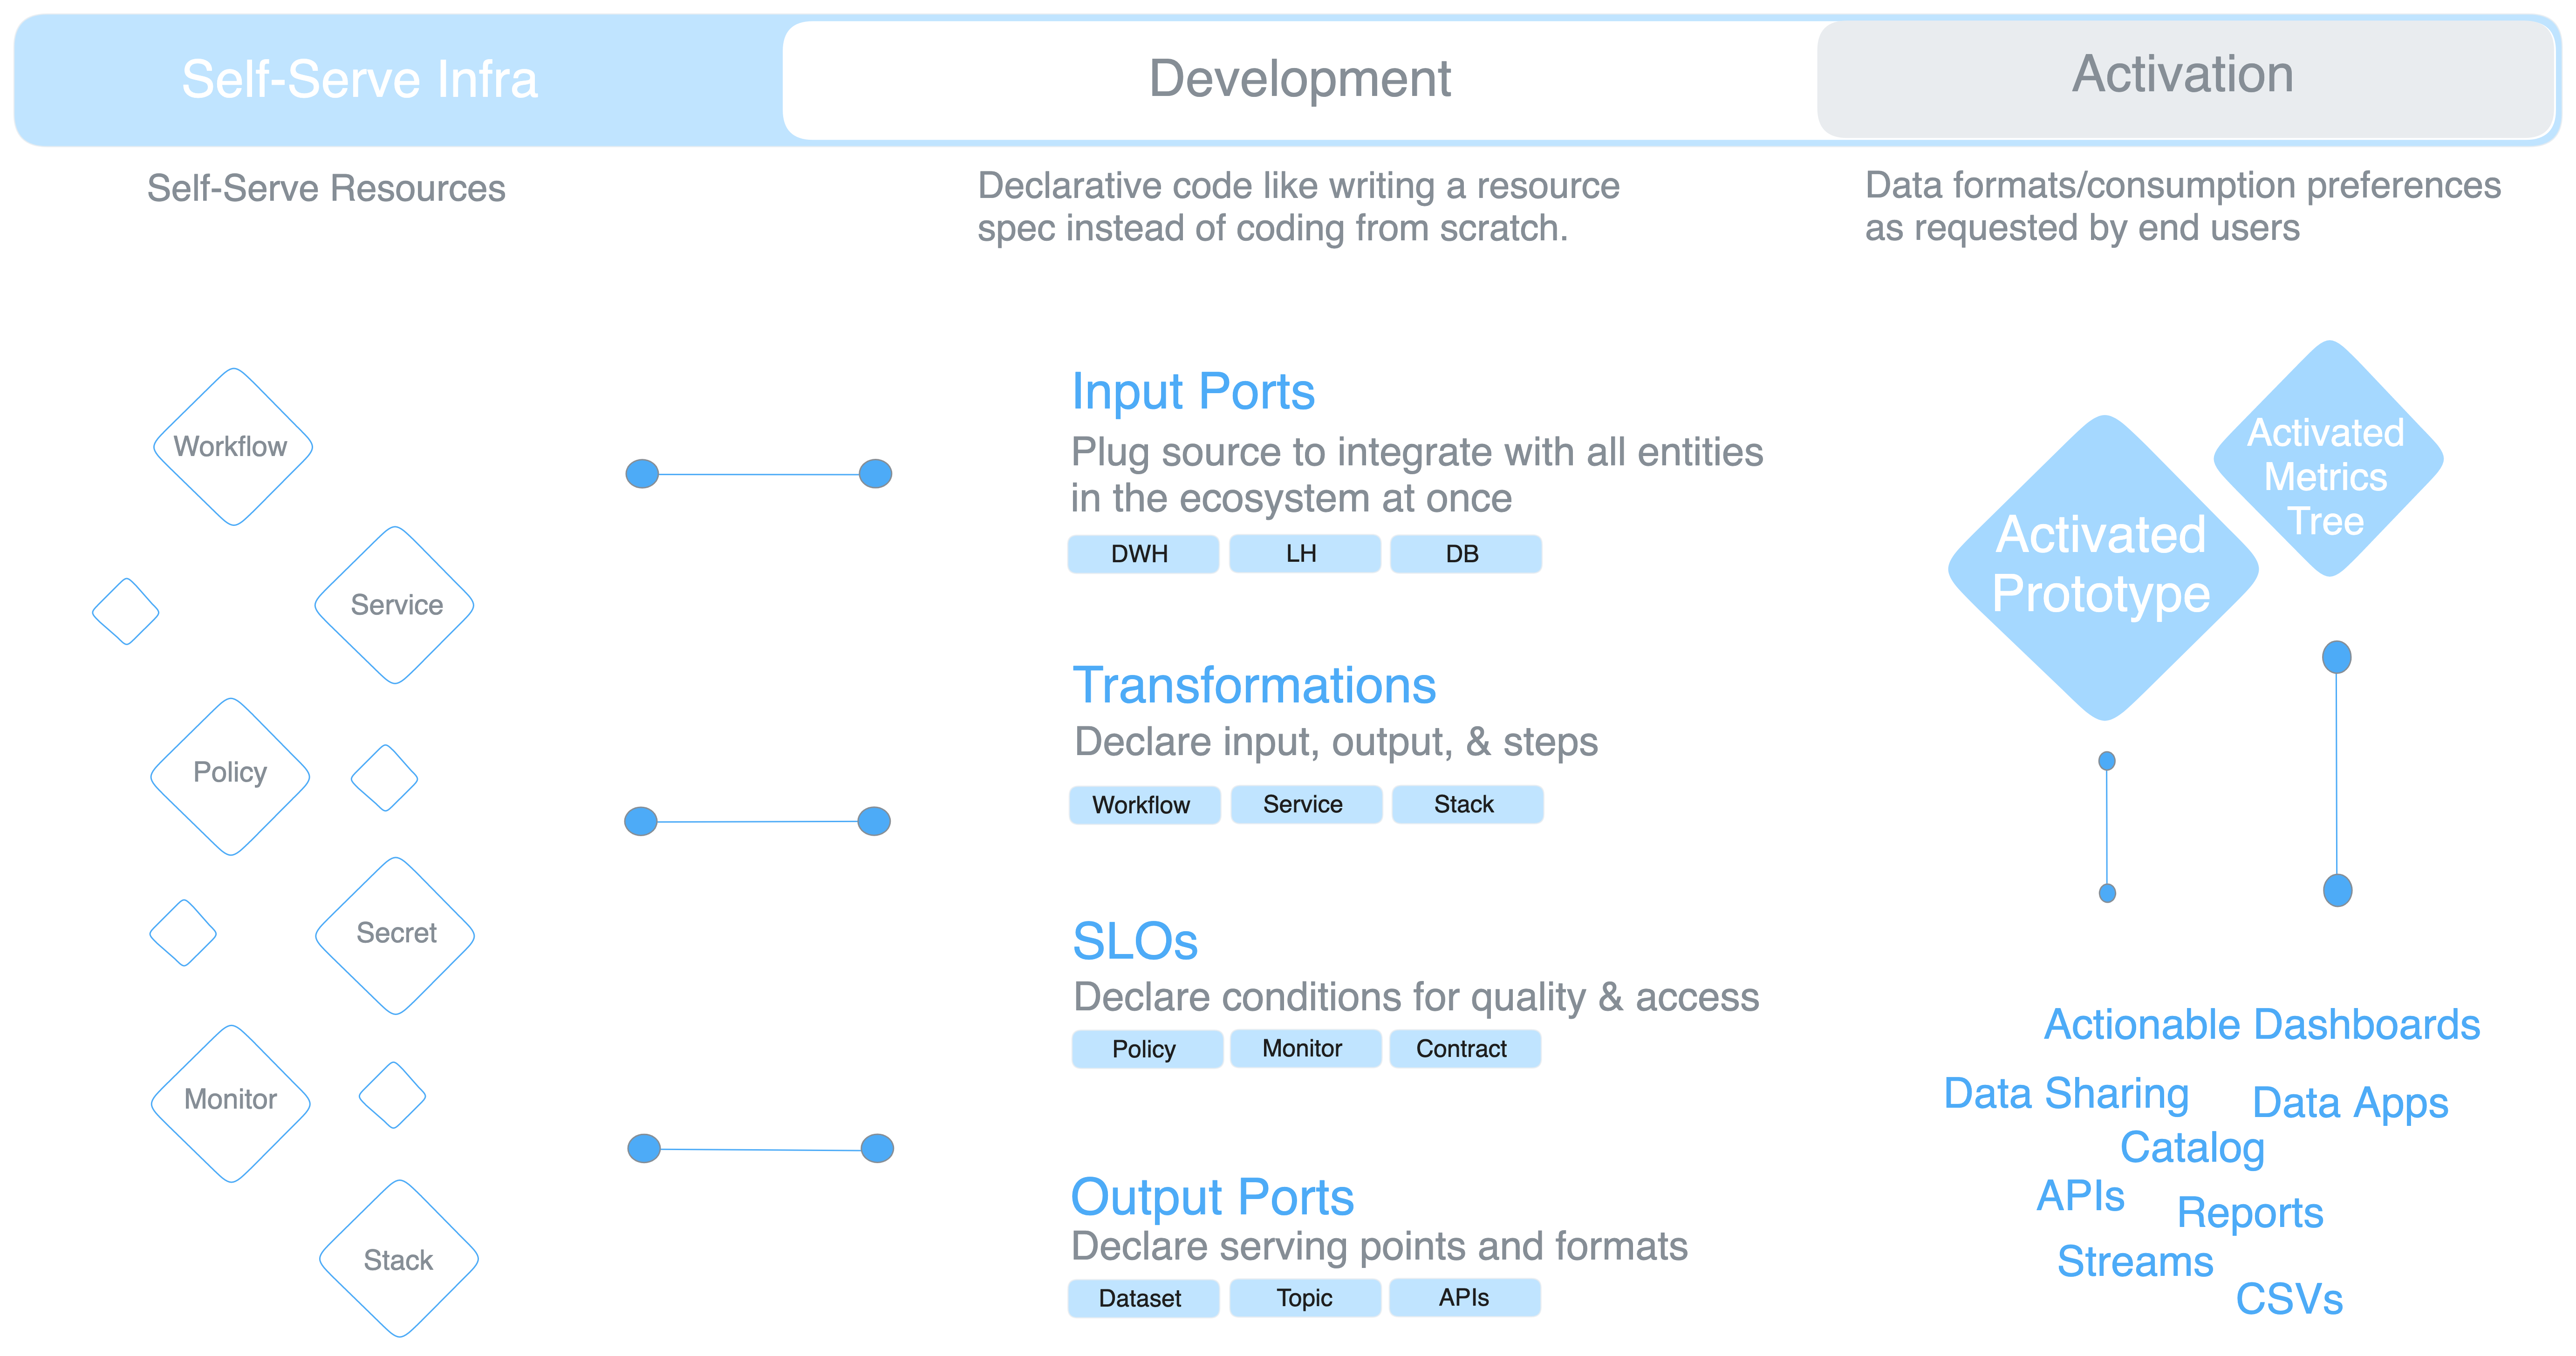
Once the prototype is validated through mock data, it needs to be activated as a Data Product. While a Self-Service Infrastructure (SSI) comes into play from the very first step, we’ll especially stress on it here as it has a significantly impactful role in bringing the data product to life.
To activate the prototype (logical model), you simply need to put together four puzzle pieces.
- Input ports
- Transformation steps
- Output ports
- SLOs
Without SSI, these four pieces aren’t as simple as just four puzzle pieces anymore. They’re suddenly equivalent to hundreds of pieces due to factors like continuous credential management, configuring workflows and services from scratch, integrating multiple tools and ensuring they work with each other, endless complex transformations that only a few old-time devs can comprehend, and on and on.
A self-serve infrastructure productises the process of developing data products - a single-minded focus on the outcome and user needs. The ‘Whats’ and ‘Whys’ instead of the ‘Hows’.
Self-service = having resources ready to use based on the user requirements (from analytics engineering in this case) Example: The analytics engineer only declares i/p o/p locations and transformation steps for data mapping, and the SSI furnishes ready-to-use workflows, services, secrets, i/p & o/p connectors, monitors, and other such resources to run the transformation.
Examples of some self-serve resources in a self-serve infrastructure are workflow, service, policy, monitor, secret, compute, cluster, contract, and others. The analytics engineer needs to only write declarative references to the resources to put together the four pieces of the product generator (i/p & o/p ports, SLOs, transforms).
Refresher
- Getting closer to business goals consistently: Create metric dependency models (metric ideation to metric evolution)
- Using reliable purpose-driven data to power required metrics: Create use-case-based logical models (data product prototype)
- Avoiding high-cost iterations: Test-drive prototype with realistic mock data
- Activating and running data products at low cost/time: Leverage self-serve infra


