


Access full report
Oops! Something went wrong while submitting the form.

🤍

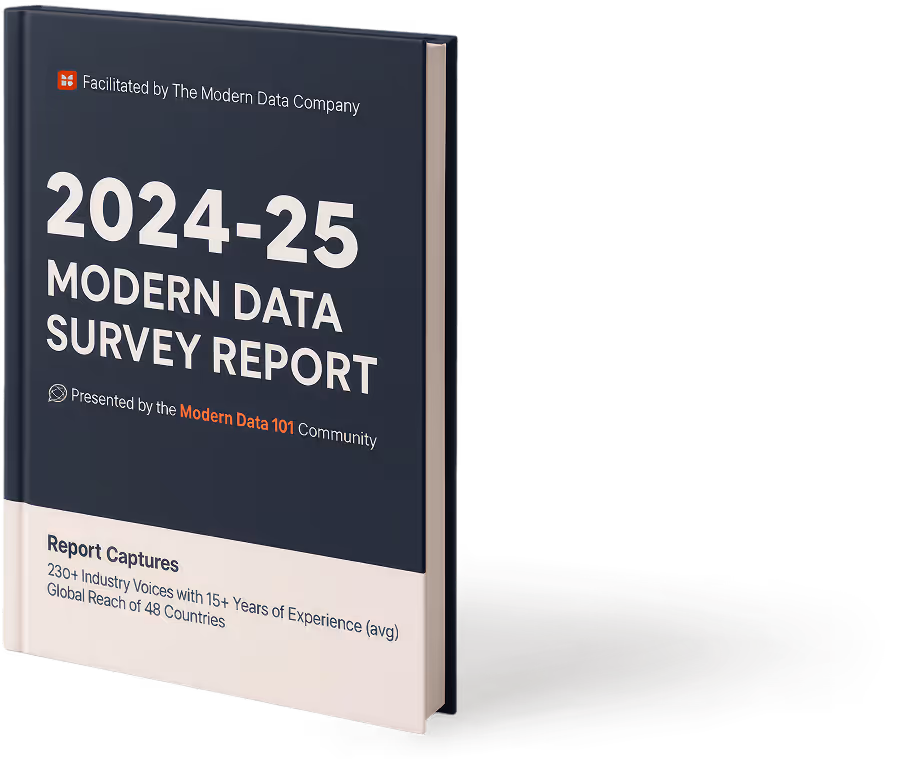
Facilitated by The Modern Data Company in collaboration with the Modern Data 101 Community
Latest reads...
.png)
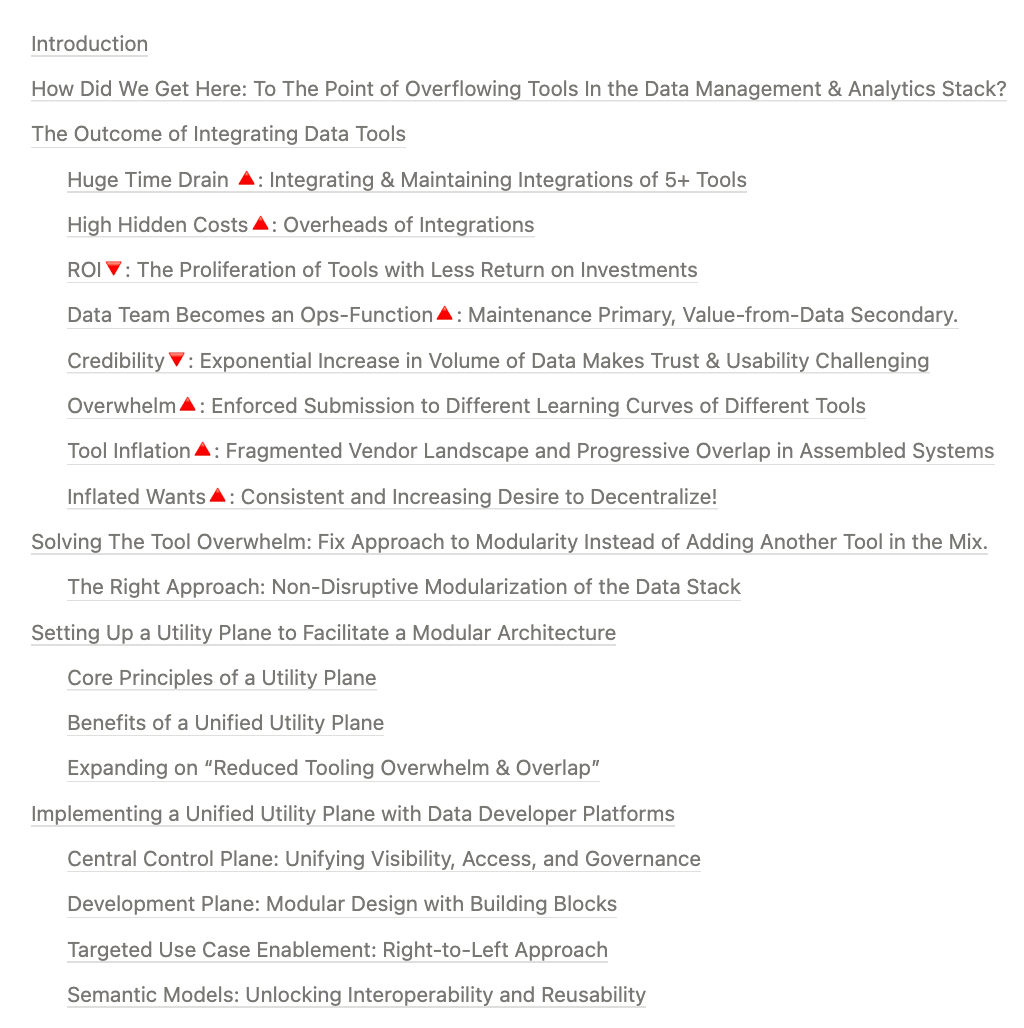
TABLE OF CONTENT


This one’s a detailed dive, so here’s a quick overview of the piece at a glance:
TLDR
Recently, in 2024, The Modern Data Company conducted a survey in collaboration with the MD101 community. The responses came from 230+ voices from across 48 countries with an average of 15+ years of experience in the data space.
One particular finding that validated our concerns was the overflow of tools across a majority of the data stacks used by the respondents and the associated cognitive overload and cost implications of the same.
Over 70% of respondents are driven to use more than 5-7 different tools or work with 3-5 vendors for different tasks, such as data quality and dashboarding. About 10% use more than 10 tools, showing the increasing complexity of the Data Landscape.
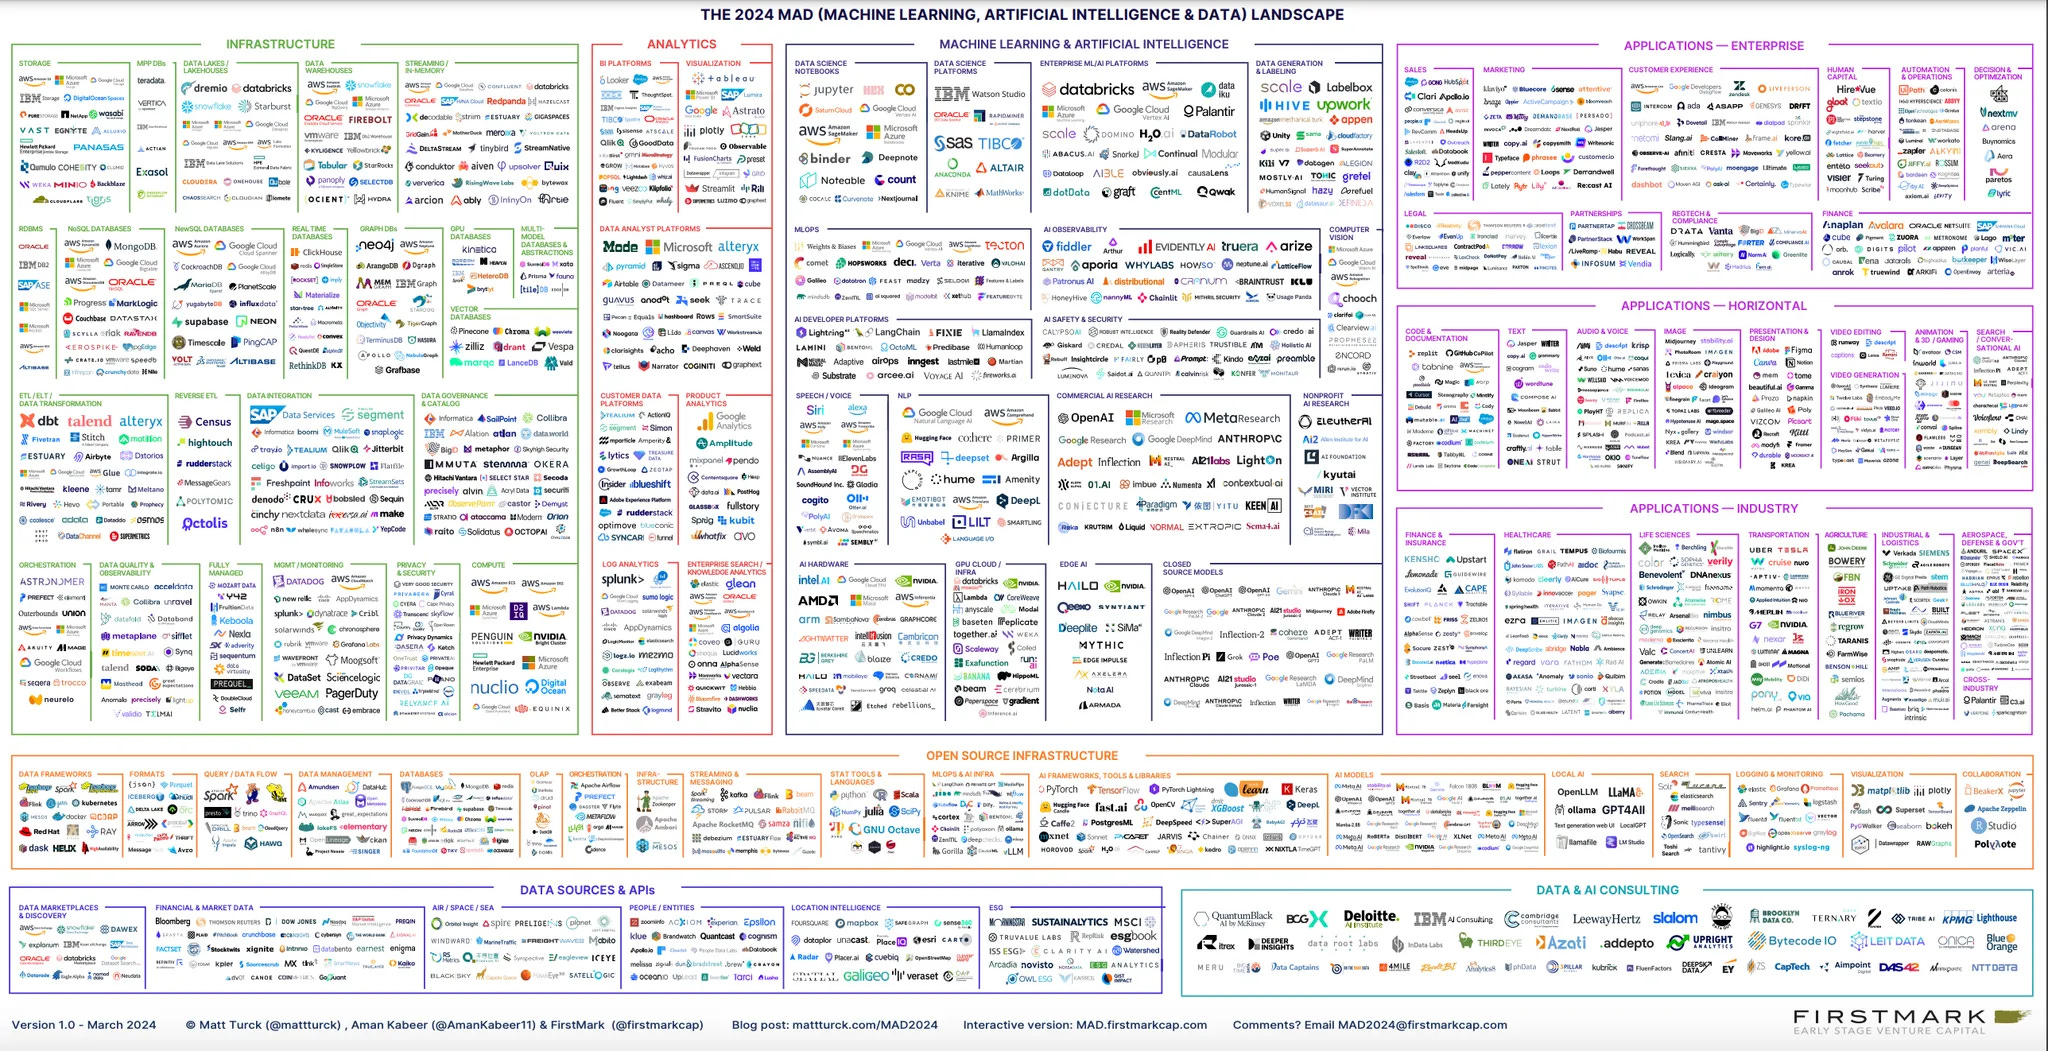
It’s getting progressively challenging for non-expert end users as data ecosystems progressively develop into complex and siloed systems with a continuous stream of point solutions added to the mix. Complex infrastructures requiring consistent maintenance deflect most of the engineering talent from high-value operations, such as developing data applications that directly impact the business and ultimately enhance the ROI of data teams. ~ datadeveloperplatform.org
The Modern Data Stack (MDS) brought around a lot of positive momentum, one noticeable impact being the shift to cloud ecosystems, which reduced barriers to entry and made data not just more accessible but also recoverable.
But with MDS, vendors and providers were overcome with solving small bytes of the big-picture problem, which was indeed the need of the hour. This tooling proliferation, especially from vendors, was catalyzed by some (among many) of these factors:
While the intention of siloed tools was to become a modular network of solutions that users could interoperate to solve larger problems, the Modern Data Stack soon became a double-edged sword. It led to a maze of integration pipelines, only a few star engineers who spent years in the organization understand - implying both a technical as well as cultural centralization of key data assets and solutions.
Users spend 1/3rd of their time jumping between tools.
About 40% of the respondents spend more than 30% of their time jumping from one tool to another, ensuring they work well together.
Consider the amount of time teams spend just to stay afloat in a fragmented tooling landscape. Each new tool requires onboarding, training, and adaptation to its unique design and workflows. Users must learn not only how to operate the tool but also how it fits—or often doesn’t fit—into their existing processes.
Switching between tools adds another layer of inefficiency, with users frequently losing context as they jump from one interface to another. This constant toggling not only slows down work but also increases the likelihood of errors.
Integration challenges further compound the problem. Teams spend hours troubleshooting integration bugs and patching up connections between tools that were never designed to work seamlessly together. Even after solving these issues, ongoing maintenance becomes a necessary burden to ensure integrations remain functional for day-to-day operations.
Also, validating the accuracy and consistency of outcomes equals a laborious task. Teams are forced to perform detailed lineage tracking, manually following the trail of data across multiple systems to confirm its validity. This process is not only time-intensive but also prone to oversight, creating a recurring cycle of frustration and inefficiency. The result? Valuable time and resources are drained on overhead tasks rather than focusing on the insights and actions that drive value.
Licensing, training, and support for multiple tools significantly increased costs.
Operational Costs
Infrastructure & Migration Costs
Licensing & Tooling Costs
Integration & Ecosystem Costs
Cognitive & Risk Costs
As you can guess, the list is quite far from exhaustive. (Source)
Decisions take time to take effect. Each tool meant patience and investment of not just resources but, more importantly, time. Decisions take time to take effect. Each tool meant resource investments, patience, and, most importantly, time.
But given the fundamental design flaw of “adding one more tool”, what follows is overheads around maintenance, integration, licensing, and opportunity costs specifically due to the investment of time.
Ultimately, the end objective of getting closer to business value is pushed further away when maintenance and integration precede core data development. More data integration tools are added to the equation to solve the gaps, and the cycle continues.
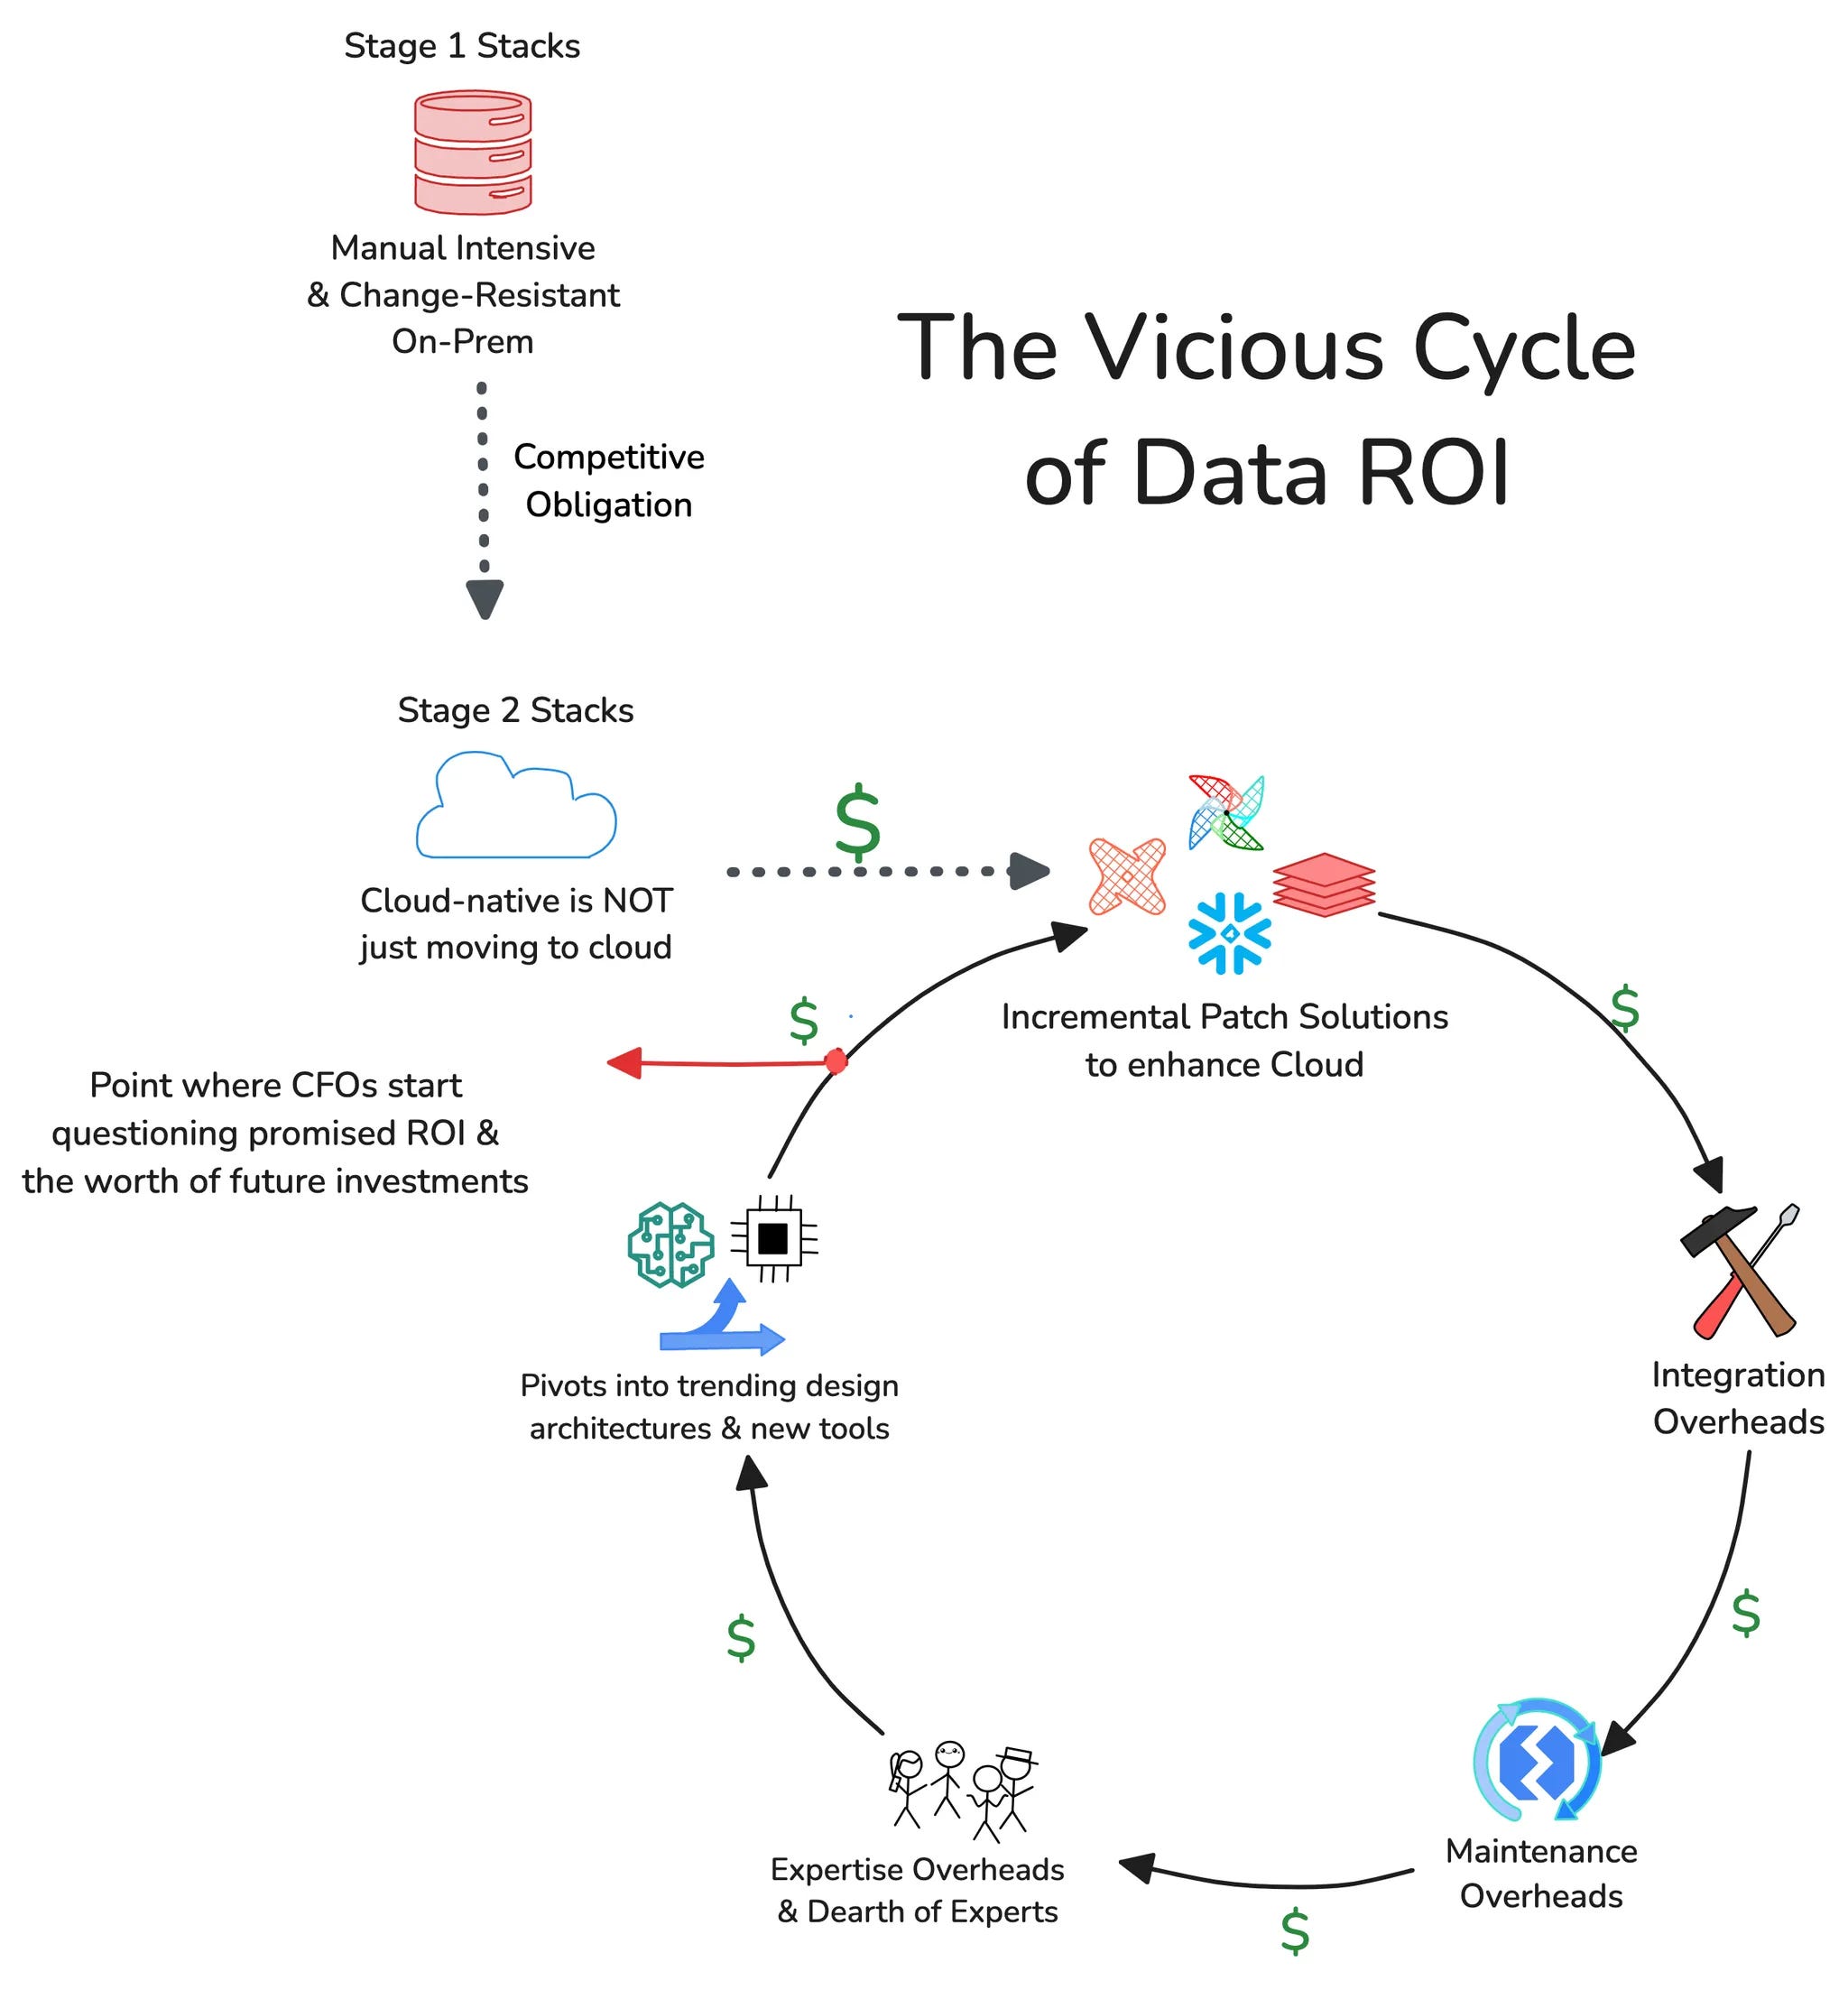
And picture this—with every iteration of new niche tooling, in addition to licensing costs for every tool, there are also additional hidden (huge) costs of premium in-app feature purchases. But much more problematic is the added maintenance cost that each tool incurs.
The cost of owning the tool significantly increases when, on top of licensing and service, an additional 15-18% is maintenance cost. If you’re spending $2M on a contract and then spending $300K in additional maintenance costs, the negative impact on ROI is huge.
About 40% say maintaining integrations between various data tools leads to the highest costs. ~Modern Data Survey (A collaborative initiative between Modern Data 101 & The Modern Data Company)
With abundant tooling, as demonstrated by the MAD Landscape or MDS, it is becoming increasingly difficult for organizations to focus on solution development that actually brings in business results due to consistent attention drawn by maintenance tickets. Data and analytics engineers are stuck in a maintenance-first, integration-second, and data-last culture. This involves countless hours spent on solving infrastructure drawbacks and maintaining debt-ridden data pipelines. And the infrastructure required to host and integrate multiple tooling is no less painful.
I think a lot of data teams run into the problem of, you know, creating metrics within their BI tool, creating metrics within something like HubSpot, or maybe another growth or marketing tool like Google Analytics. And then, you have three different answers for the same question.
It just makes stakeholders lose trust in the data because they don't understand why there are three different answers to the same question. They don't know what to depend on.
~ Madison Schott, Sr. Engineer at Convertkit (Source)
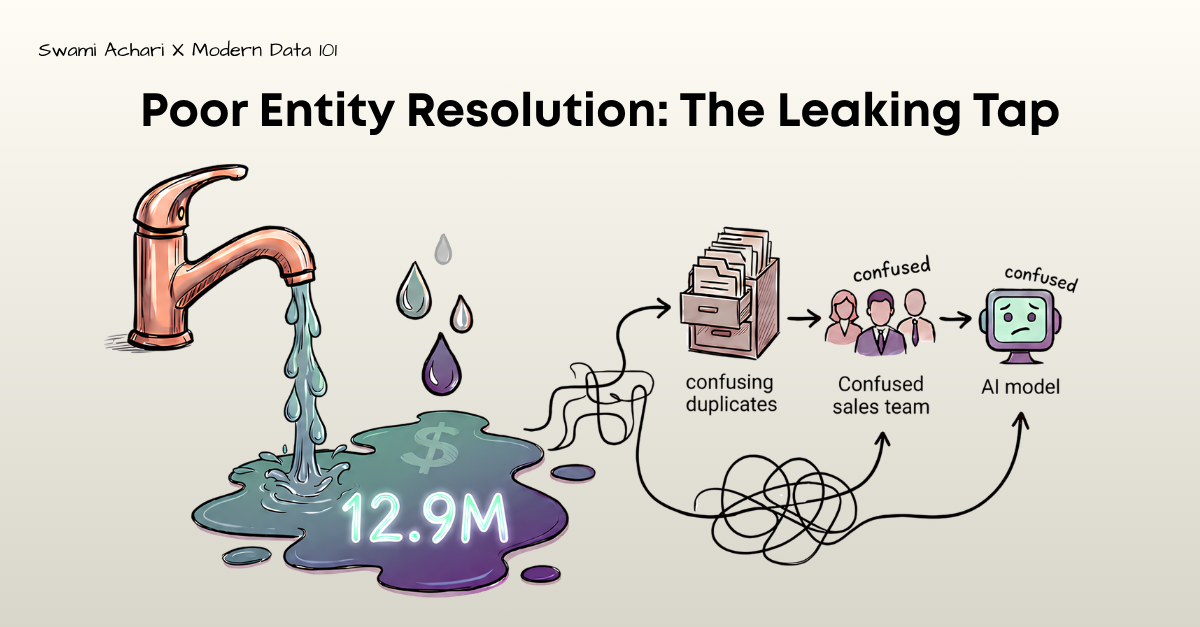
With data flowing (read: duplicated) between multiple tools across different domains (preferred native stacks), there is unchecked corruption, and it is increasingly difficult to track the lineage and root cause as the proliferation of tools continues. More often than not, to make their lives easier, business users often prefer to simply duplicate the data instead of spending hours or weeks waiting for the integration bridge to get fixed or renewed. This comes from a deficit in awareness of the implications of data duplication or corruption and also the frustration from time lags and inefficient data supply to business use cases.
And without proper integration bridges, there’s no stable model that data developers and business users can rely on. Instead, a legacy model at best with incomprehensible branches - branched out every time a new requirement came in, facilitating the immediate need for facilitating a new tool pipeline or answering a new business query/request.
Every tool has its own design language based on its own design philosophy and approach. This implies different languages, formats, frameworks, or lifecycles. Making interoperability much more complex and selective as well as enforcing steep learning curves to make things work consistently.
End-users who expect value from the tools or data engineers responsible for making the tools talk to each other are expected to learn the design approach of each. Which are often not simple. Even if they were, the need to learn the workarounds for 5-7 tools and integrate them in a user-friendly way disrupts all laws of simplicity and adds to the cognitive overload.
There was also a socio-political driver of competing with each other that led to similar features popping up across the vendor landscape—claiming to one-up the other. Also, organically, as more tools popped in, they increasingly developed the need to become independently operable, often based on user feedback.
POV: Technical inevitability of a fragmented stack
For instance, two different point tools, say one for cataloguing and another for governance, are plugged into your data stacks. This incites the need not just to learn the tools’ different philosophies, integrate, and maintain each one from scratch but eventually pop up completely parallel tracks. The governance tool starts requiring a native catalog, and the cataloguing tool requires policies manageable within its system.
POV: Inevitability of the business strategy of niche vendor solutions
Vendors began to overlap in features as they competed for market share, making it harder for organizations to consolidate their stacks. For example, a vendor that started with data storage offerings started providing options for cataloguing, data quality, transformation, and so on.
Now consider the same problem at scale, beyond just two point solutions. Even if we consider the cost of these parallel tracks as secondary, it is essentially a significantly disruptive design flaw that keeps splitting the topology of one unique capability into unmanageable duplicates.
Moreover, a lot of capabilities of niche tooling went unused due to overlaps or simply from a lack of requirement (too niche for 80% of the use cases). Unfortunately, that also meant that users/adopters had to keep paying for, say, 100 features of the tool while they were only using 5.
When systems are pieced together without a cohesive strategy, managing their many moving parts becomes overwhelming. This complexity spills over, making it harder for end users to access the data they need.
Teams like marketing, sales, and support often have to jump through hoops to retrieve even basic insights. Meanwhile, the central data team becomes overloaded with requests, leaving the organization struggling to clear bottlenecks and share the workload across domains.
This is where the early Data Mesh movement put the spotlight on domain ownership—a shift toward decentralization. The idea is appealing: let individual teams manage their own data. But how practical is this approach in the real world? When applied to a functioning business, a few key challenges start to emerge:
It’s both a skill- and resource-deficit issue. Moreover, with decades spent on evolving data stacks with not much value to show, organizations are not ideally inclined to pour in more investments and efforts to rip and replace their work. In essence, Autonomy is of higher priority than Decentralization if a domain’s self-dependence is the ultimate objective.
The intention of siloed tools that targeted specific problems was to become a modular network of solutions that users could interoperate to solve larger problems…
Why is this approach flawed?
Modularity comes from having the simplest form of solutions available as independent building blocks that could be put together in a desirable combination to act as larger solutions. Just like the modular approach to coding, the simplest functions are reusable across the project as classes or even other projects as libraries.
The tools that target specific problems do not act as the simplest unit of solutions but are, in fact, large solutions themselves, directly targeting big chunks of the problem, e.g., Data Quality or ETL.
Each component of this already large solution (tool) does not know how to talk directly to other large solutions (base components of one tool cannot be reused in other applications or solutions). Instead, the whole tool needs to be used through a complex integration with all its very specific design and workflow nuances.
There are two keys to this solution:
Interestingly, modularization, which means splitting a large problem into the lowest forms of independent solutions, enables the unification of the data stack. Note that “Splitting” and “Unification” are in the same sentence. On the other hand, large solutions (niche tools) contribute to more siloes by withholding data and base components within stricter boundaries.
By careful analysis of many implementations, we’ve found that lego-like modularity, enabled by unified data platforms like the Data Developer Platform standard, leads to:

This is in huge contrast to traditional data stacks, which are a collection of tools forced to talk to each other through complex and highly time-consuming integrations. Leading to the following experience of data practitioners in the industry:
A Utility Plane acts as the foundation for enabling modularity by providing a set of core utilities and services that are lightweight, reusable, and interoperable across the data stack.
Unlike traditional tools designed for specific niches, the utility plane focuses on delivering atomic, building-block capabilities that can be composed and orchestrated to address diverse use cases.
📝 Related Reads
Beyond the Data Complexity: Building Agile, Reusable Data Architectures Why Evolutionary Architecture is Important in a Data-Driven World
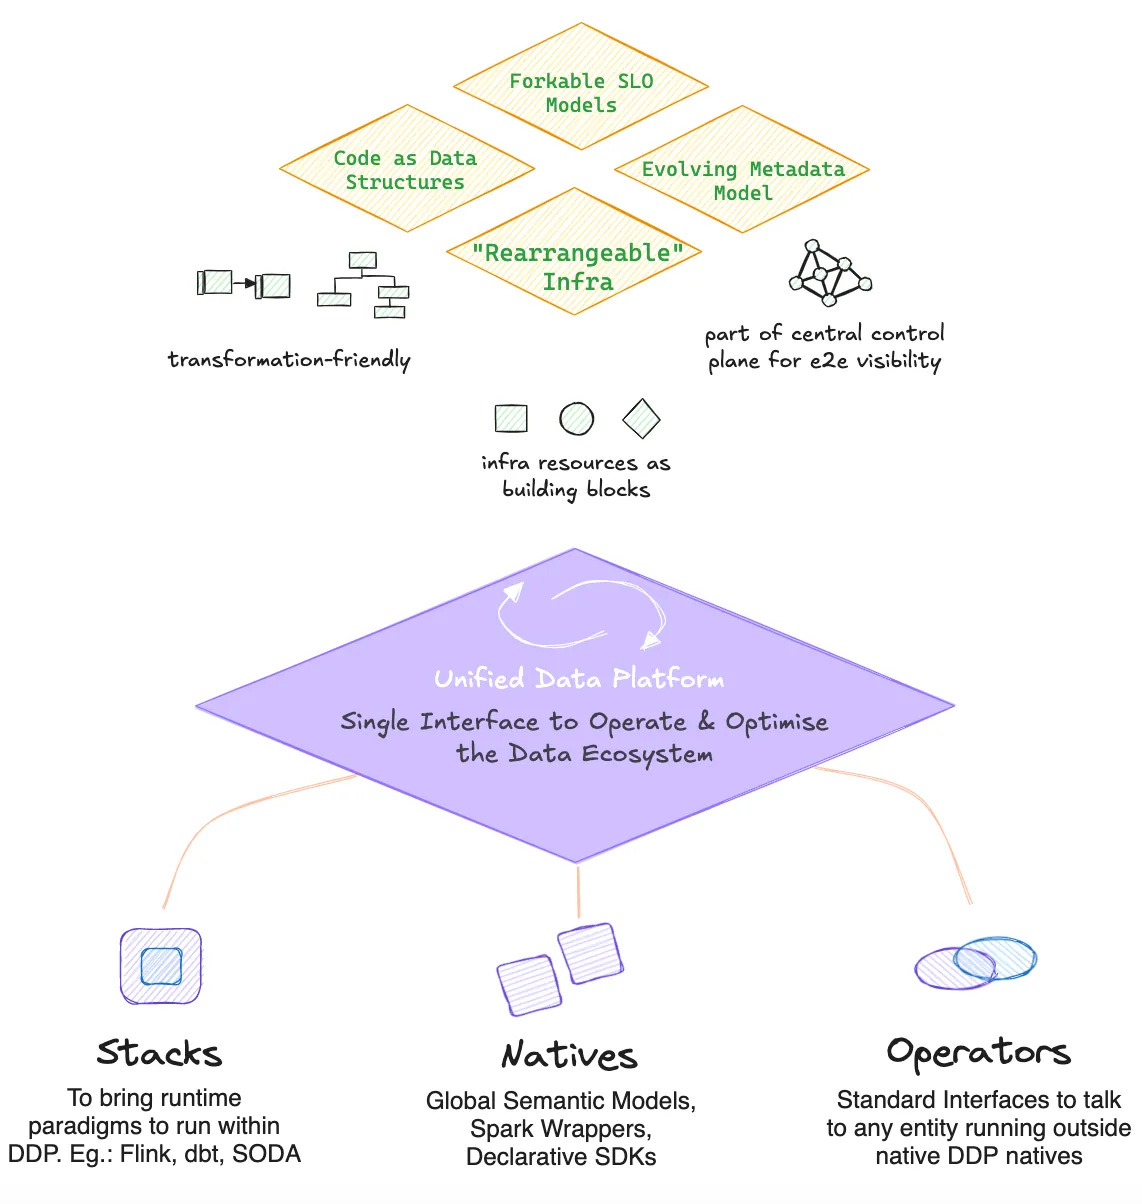
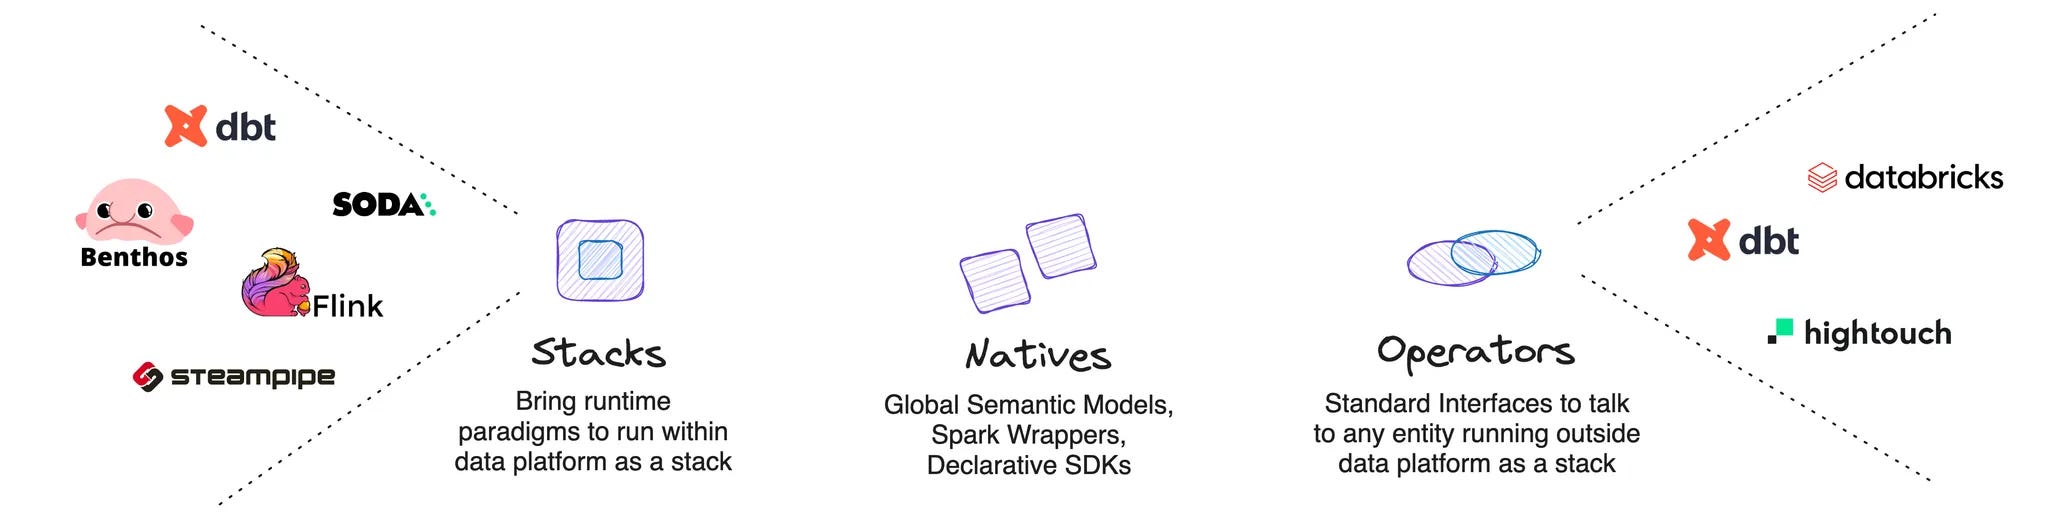
By establishing a utility plane, we cut down tool-centric siloes with a modular and unified architecture. This is especially enabled through three design paradigms of a Utility Plane:
How does this help? One-time integration development and continuous health management are delegated to the platform through declarative means. Moreover, these foreign paradigms are encapsulated in a way that aligns with the platform’s unified standards, enabling users to access and operate different stacks through a common interface and pattern (cutting down the cognitive overload and learning curves that come with different tools).
Over time, having a common operating interface helps the organization come up with a more unified data strategy to condense not just tooling options but the approach to work as a whole. The ability to clearly bundle “building blocks” to specific solutions under domains gives organizations the sheer ability to attribute costs to domains as well as understand the implications of different existing tools on the overall cost-time efficiency.
For instance, the out-of-the-box ability of unified platforms to manage data product lifecycles and optimize data product value and performance by:
Data Platforms modelled after the Data Developer Platform (DDP) standard serve as a non-disruptive utility layer seamlessly integrated into existing data infrastructure. Acting as a critical enabler, this utility layer ensures modularity and alignment with specific business goals while maintaining the integrity of current operations. The architecture cultivates a unified approach to managing data workflows across the end-to-end Data Product Stack.
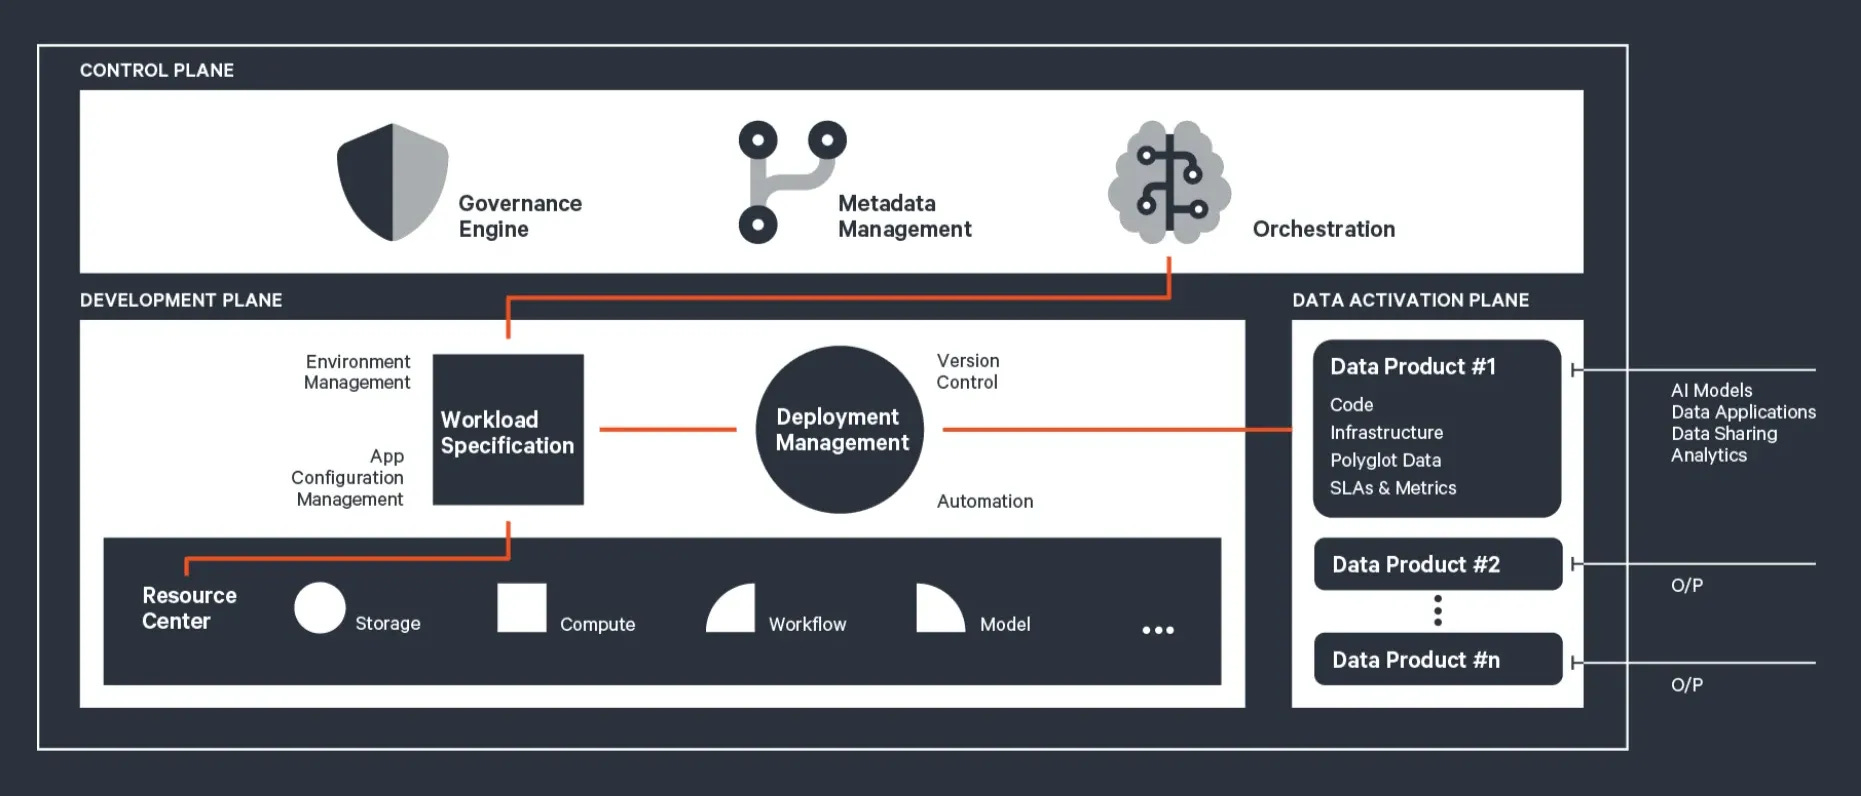
When any tool or stack is plugged into the platform, the Central Control Plane gets complete visibility and anchors the system by providing end-to-end visibility to other integrated tools and standardization through its three core engines:
This model is based on the principles of Hybrid Decentralization, which strives to enable domain-driven decentralization within feasible boundaries. You can learn more about our approach to hybrid decentralization here and here.
The Development Plane is designed to modularize code, workflows, and resources, presenting them as reusable building blocks. These building blocks can be tailored to specific use cases, enabling a composable architecture. This is where data developers can utilize the three design paradigms (native resources, stacks, and operators) to build modular solutions for data products, specific business queries, global metric models, and so much more.
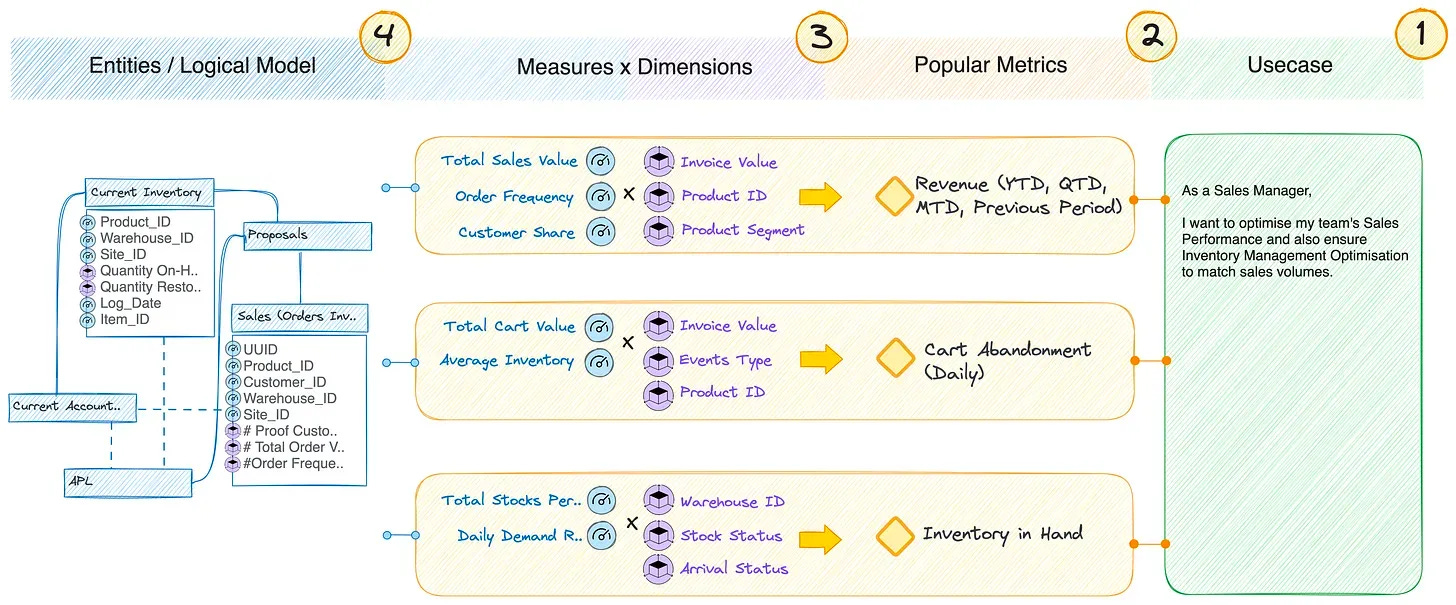
The platform's design emphasizes a right-to-left flow, starting with the business outcome and tracing backward to define the technical execution. For example:
This reverse-engineered methodology ensures that every technical effort is laser-focused on driving measurable business impact.
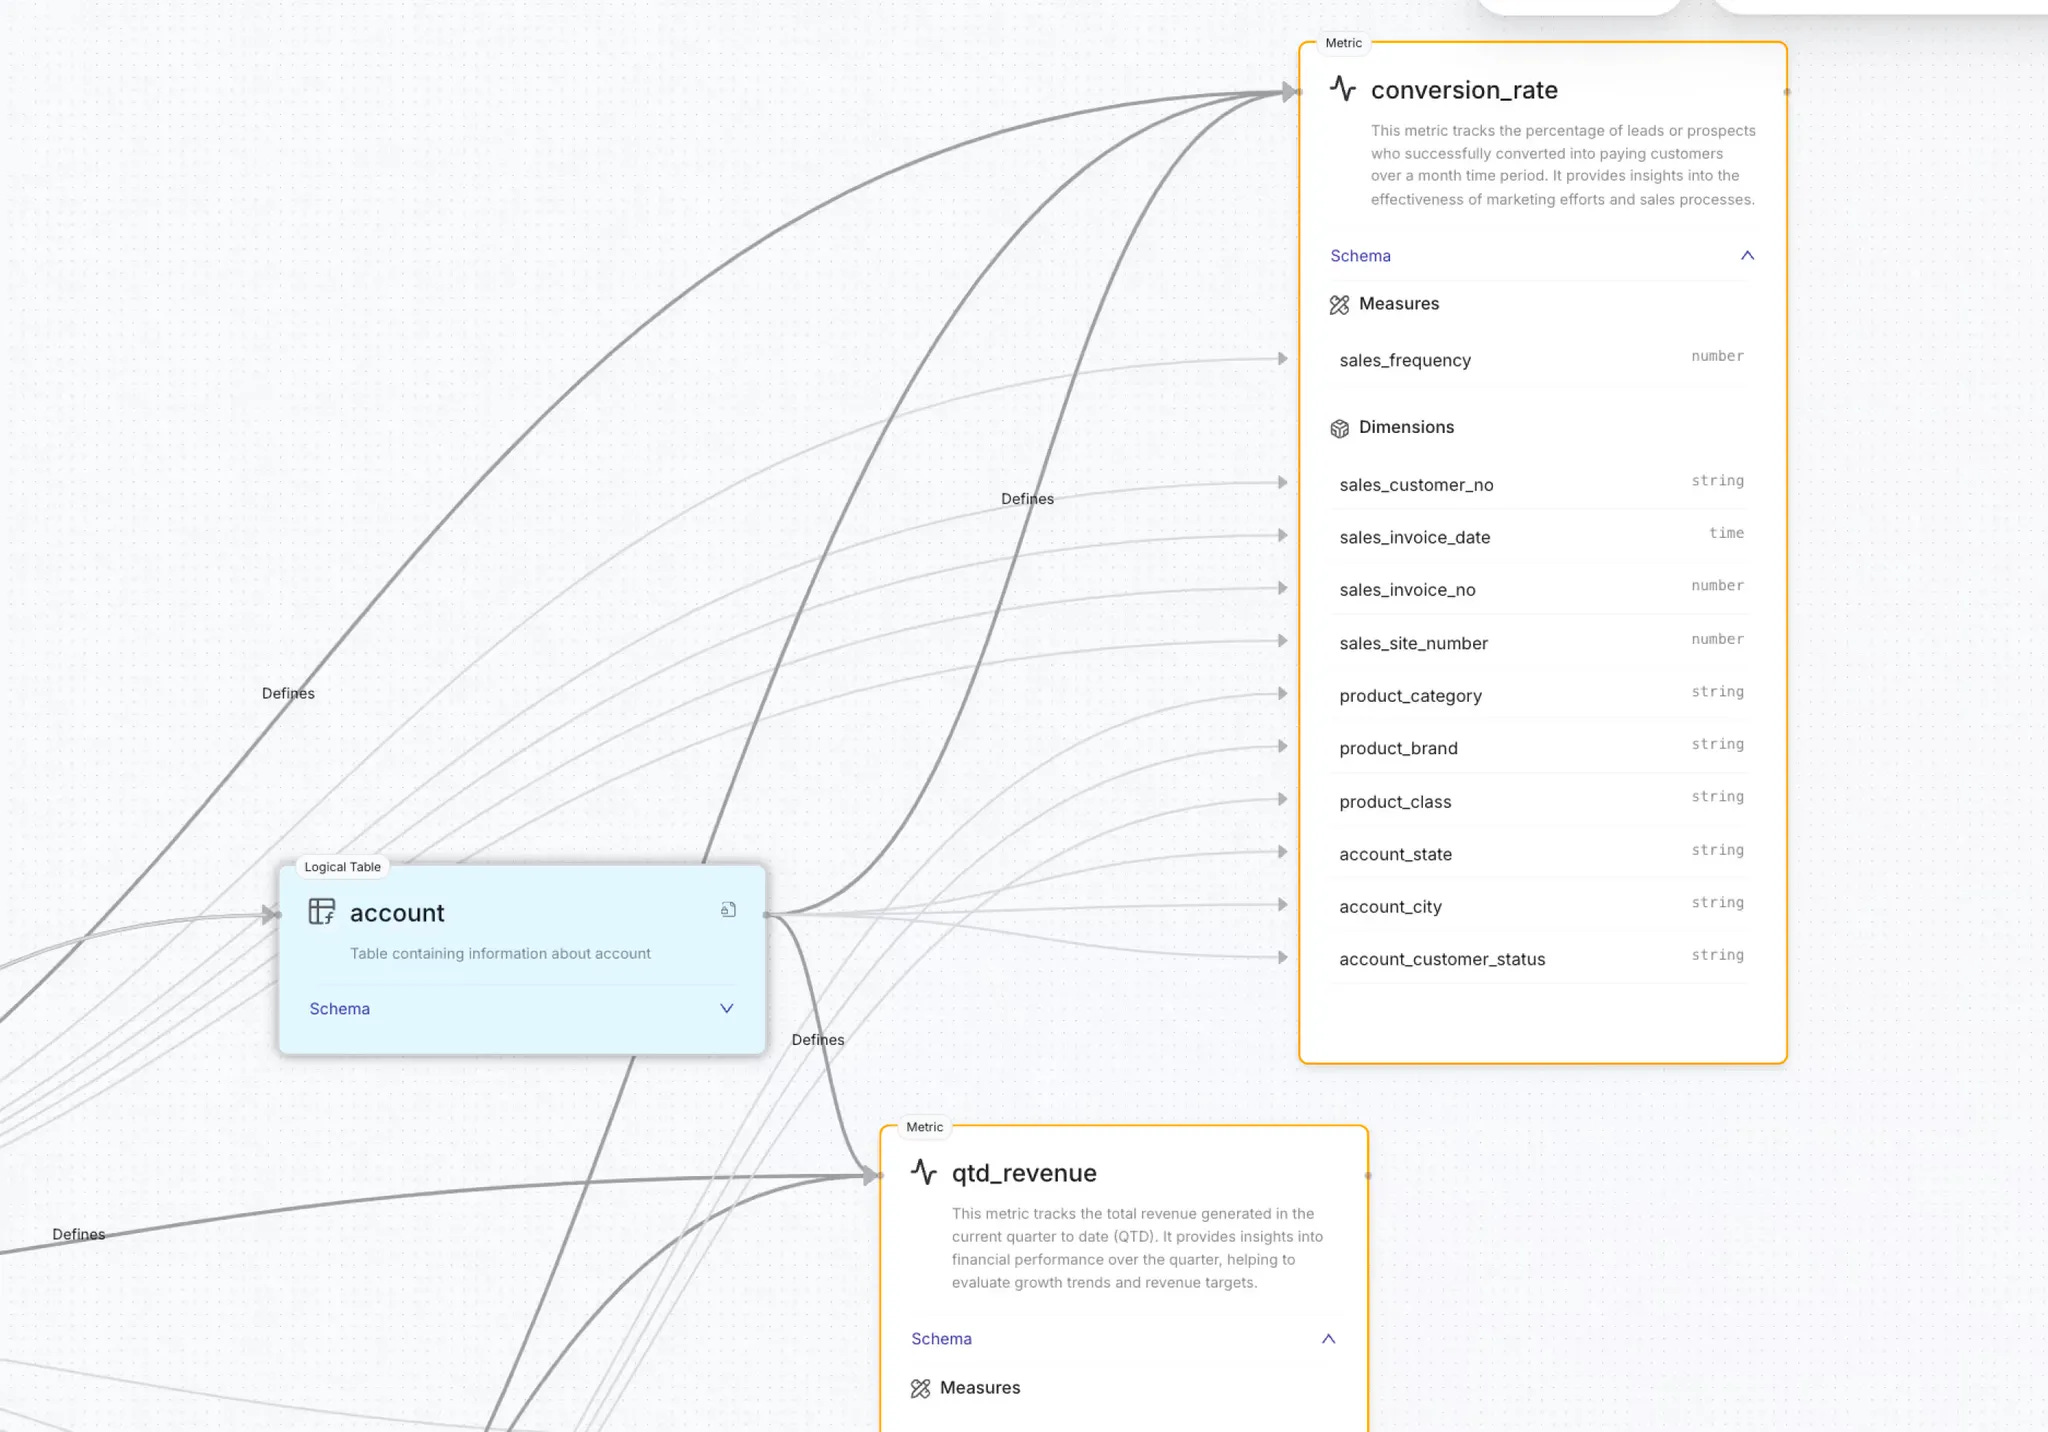
Semantic models play a pivotal role in bridging the gap between technical layers and business outcomes. Acting as a shared vocabulary across stakeholders, these models:
By integrating semantic models into the architecture, the DDP transforms raw data into actionable insights while ensuring alignment with business objectives.
📝 Learn More About Data Developer Platforms
datadeveloperplatform.org
Thanks for reading Modern Data 101! Subscribe for free to receive new posts and support our work.
If you have any queries about the piece, feel free to connect with the author(s). Or feel free to connect with the MD101 team directly at community@moderndata101.com 🧡
Connect with me on LinkedIn 🤝🏻

Connect with me on LinkedIn 🙌🏻
Connect with me on LinkedIn 🤜🏻🤛🏻
Your Copy of the Modern Data Survey Report
Better decisions start with shared insight.
Pass it along to your team →
Your Copy of the Modern Data Survey Report
Better decisions start with shared insight.
Pass it along to your team →


Find more community resources
Modern Data 101 is a movement redefining how the world thinks about data. A community built by the same team behind the world’s first data operating system, Modern Data 101 sits at the intersection of data, product thinking, and AI. Spread across 150+ countries, the community brings together a global network of practitioners, architects, and leaders who are actively building the next generation of data systems.
At its core, Modern Data 101 exists to simplify the journey from raw data to tangible and observable impact. It advocates high-potential data systems and next-gen architectures to unify and activate insights and automation across analytics, applications, and operational workflows at the edge.
In a world shifting from data stacks to AI ecosystems, Modern Data 101 helps teams not just navigate the change but lead it.

Find all things data products, be it strategy, implementation, or a directory of top data product experts & their insights to learn from.
Connect with the minds shaping the future of data. Modern Data 101 is your gateway to share ideas and build relationships that drive innovation.
Showcase your expertise and stand out in a community of like-minded professionals. Share your journey, insights, and solutions with peers and industry leaders.


