


TABLE OF CONTENT
This blog will walk you through the initial stages of the data product lifecycle, focusing on the importance and nitty-gritty of market research for identifying user problems, delineating critical KPIs, and describing specific user journeys. This piece also highlights the concept of semantic engineering and validating the business model for building data products.
Much like product development, the first stage in building data products is Design. In this article, we are addressing the nuances of the design stage specifically.
This piece is ideally suited for a Data Product Manager or a data practitioner performing the functions of a Data Product Manager. We’ll dive right in.
Overview: Data Products Design Stage
1. Market Research
2. User Problems and User Journey
3. Semantic Engineering
4. Business Model Validation
5. Source Mapping & Semantic Query Validation

🔬 Market Research
In the larger landscape of building data products, the first and most critical stage is to do thorough market research and find out the validity of your data in your consumer market.
Examples of some questions and gaps that need to be answered at this stage:
Is your data unique, and for how long? What is the value proposition of your data product?What segments of the population find the most value in your data product? Is it access & licensing you care about, or is it a data product that reshapes your data? How much do you know about customers’ willingness to pay?
Reference
Through this research, the users/personas the data product can optimally serve surface up, and then each of these personas needs to be assessed.
📝 User Problems & User Journey
Once the users are identified, their user journey needs to be mapped out, and accordingly, the pain points across their journey are surfaced and picked out.
- Channeling requirements from these users based on their challenges
- Drafting the user journey map: how, where, and why they consume your data
- Metrics Identification (value proposition) - Tying efforts to prima metrics
Why tie to high-level metrics
Shouldn’t getting the problem statements from users be enough? Not when it comes to building data products. There are multiple personas that one data product is qualified to serve. Therefore, picking user problems has to be a selective process. Tying back impact to primary metrics such as the ROI, P&L, or Time to Revenue helps assess a user problem's value proposition and prioritise accordingly.
Why now and not later
Identifying the metrics the user problems tie to is critical at the design stage, especially while charting the user journey, as it helps plan, deploy, and prioritise data efforts.
Drafting the business metric model
Refer to Data Product Strategy - Business Metric Model, aka SLO model. The business metric model also suggests the BCG matrix to prioritise the right metrics and take up user problems accordingly.
Some important questions during design, as addressed by the Data Product Pyramid.

👷🏼Semantic Engineering
Defining Ownership
A data product would have several limbs to manage different capabilities, such as governance, observability, discoverability/accessibility, RCA, and more. So, even before semantic engineering kickstarts, the personnel responsible for different tracks needs to be established to have end-to-end accountability for effectively building data products.
The data product manager plays a key role in this ownership matrix and plays an important new role in the data ecosystem, performing the same duties of a product manager with respect to data and bridging the gap between engineering and data citizens (consumers & producers).
The RACI matrix is an ideal way to define and distribute the ownership among different personas.
Responsible: Does the work
Accountable: Owns the work
Consulted: Contributes to the work
Informed: Looped in for updates

Designing the Business Model
Discover
Reusability is one of the most important capabilities in data management, specifically while building data product. The more usable you can make any data asset or operation, the simpler and more cost-effective the pipelines will become. Therefore, even before starting the modeling process, existing assets and pipelines should be discovered for reusability.
This is feasible through lineage graphs and metadata graphs that are efficiently populated with past data products. Once the right assets and pipelines are discovered, they can be set aside for plugging into the new semantic model. Also, discovery and modeling are not necessarily consecutive stages but rather iterative since new requirements can surface while designing the model.
Industry-specific templates
Before jumping into modeling for building data products, the marketplace also needs to be scanned for existing templates built for the specific industry or domain. These existing templates can then be forked and customised to create new models, altogether avoiding the cognitive overload of designing from scratch.
For example, if a customer upselling model is being developed, an already existing customer360 template can be partially forked to avoid creating the basic structure of the new model again. These templates are ideally available in a data product marketplace where templates and standard industry-specific designs are published as and when successful models are deployed.
Launching a collaborative interface or a “Figma for Data Products”
To kickstart designing a collaborative interface is necessary since the semantic model needs to pass through various personas for planning, approval, and building. This framework is not just for wire-framing data products, but also for ideating and experimenting on different simulations. For instance, planning would involve business users such as analysts, approval would involve business managers, governance stewards, data product managers, and sometimes even CDOs, and development would involve visibility for data and platform engineers.
The design interface has to be shared across all these resources along with governed access. For example, DataOS Lens fosters this capability through project-based semantic modeling interfaces governed by access and data masking policies. Business personnel could design their requirements here and pass them on to data engineers, who only need to map the right sources to the model, reducing tons of cognitive overload on the engineer's plate.
To make the right choice when it comes to a collaborative designing interface, filter available tech through some of these questions.
Source

Semantic Modeling
Semantic modeling is executed in two parts when it comes to data products:
Business Metric Model
A business metric model is a model of all the business metrics that are impacted by the data we are designing for. A metric model provides a direct interface and has a direct correlation to business processes and goals. This also makes it more comprehensible and manageable for business teams who otherwise host significant friction against learning low-level specifics. A model at the business level instead of at the product or data level ensures low friction to culture transition.
Specifics
All metrics tie back to primary business goals, e.g., TTROI. Every node represents either a metric or a sub-metric. Every edge represents how each sub-metric enables or impacts a higher-order metric. This model is solely influenced by "business change drivers"
Defining a business metric model is critical to understanding the impact of data efforts on key business levers and prioritizing, commissioning, or decommissioning efforts accordingly.
📖 More on designing a business metric model and effort prioritisation here.
Semantic Data Model
A semantic data model is a logical data model that is decoupled from physical data, making it more flexible, damage-controlled, and cost-effective. A semantic model, just like a data model, defines business entities that are key to the business, dimensions that describe the entities, relationships between the entities and dimensions, and measures or metrics that help assess different objectives.
The measures/metrics in this semantic data model are powered by output ports of the data products. These metrics tie back to the business metric model and help business teams envision how changes in different metrics and efforts are impacting the key business objectives.
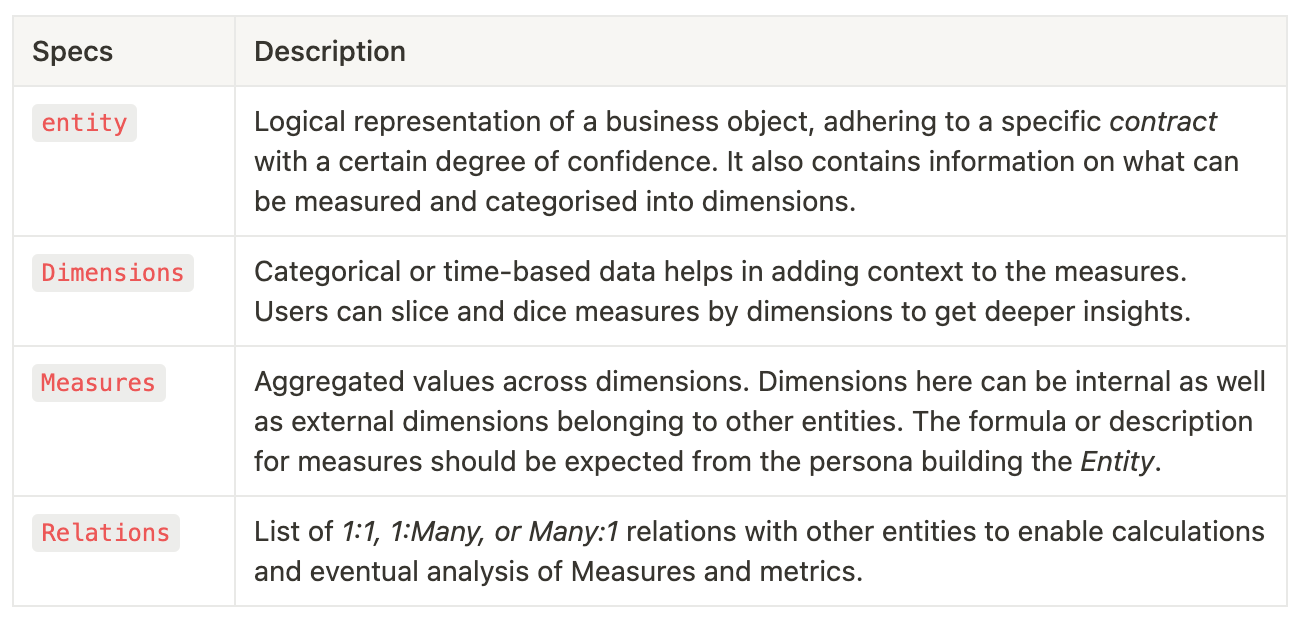
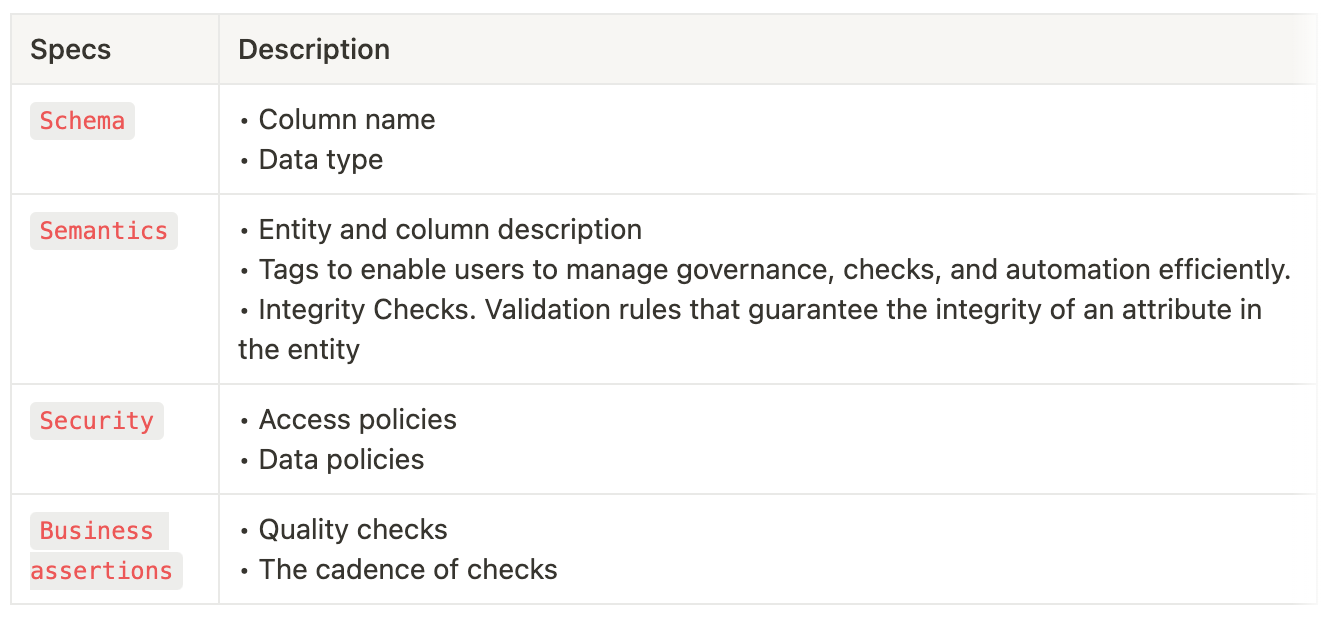
The semantic model also defines the requirements and expectations from data with respect to schema, semantics, security, and business assertions.
✅ Business Model Validation
Once the business metric model and semantic data model are ready, development must be stalled until the models are validated. This is to reduce the number of iterations and rework.
Mock Data as a Service
Having the right mock data to test out the model is challenging due to domain-specific requirements when it comes to data types and values. Mock data as a service enables the right conditionals levers that domain experts can exploit to generate realistic synthetic data and assess the validity of the models without putting any effort into mapping the physical data for the entire model. This also prevents corrupted physical data.
Presenting value and impact on KPIs
The mock data shouldn’t just be used to validate the relationships and dimensions in the semantic data model but is also essential for understanding the range of change in the key business metrics or KPIs. This visibility allows business teams to re-assess their metrics and create more impactful metrics with trials and errors without any collateral damage or exploitation of engineering resources. These metrics would go on to form the backbone of all data-driven efforts and need to be impactful and stable for the business.
📍 Source-Mapping and Semantic Query Validation
On having verified semantic models in place, the data engineering team can be pulled in to map the applicable data sources to the model entities. In prevalent systems, the central engineering team is responsible for defining the business models, which results in inaccuracies and frustrating iterations. This is because they only have a partial view of the business landscape.
The semantic model snips out these dependencies and only leaves data mapping on the engineers’ plate. The business teams are responsible for defining the accurate business model, and the data engineering team now only needs to make sure the source data reaches the right place. The mapping is governed by policy-driven and condition-driven SLOs that the data engineers are required to completely or partially fulfil.
Not fulfilling these requirements during mapping or after it would result in warnings or blocked pipelines for the benefit of the business user. Once the sources are mapped, the business teams can validate the mapping through semantic queries where data is presented as dataviews, and on fulfilment of the requirements, they can materialise these views into their desired applications and channel in the physical data.
All these interfaces and capabilities necessary for this stage of designing data products are furnished by data platforms modeled after the Data Developer Platform Standard, alongside other interfaces for the subsequent stages of Build, Deploy, and Iterate - all under one unified hood instead of a fragmented tooling experience.


