
Access full report
Oops! Something went wrong while submitting the form.

🤍

Facilitated by The Modern Data Company in collaboration with the Modern Data 101 Community
Latest reads...
%20(1).png)
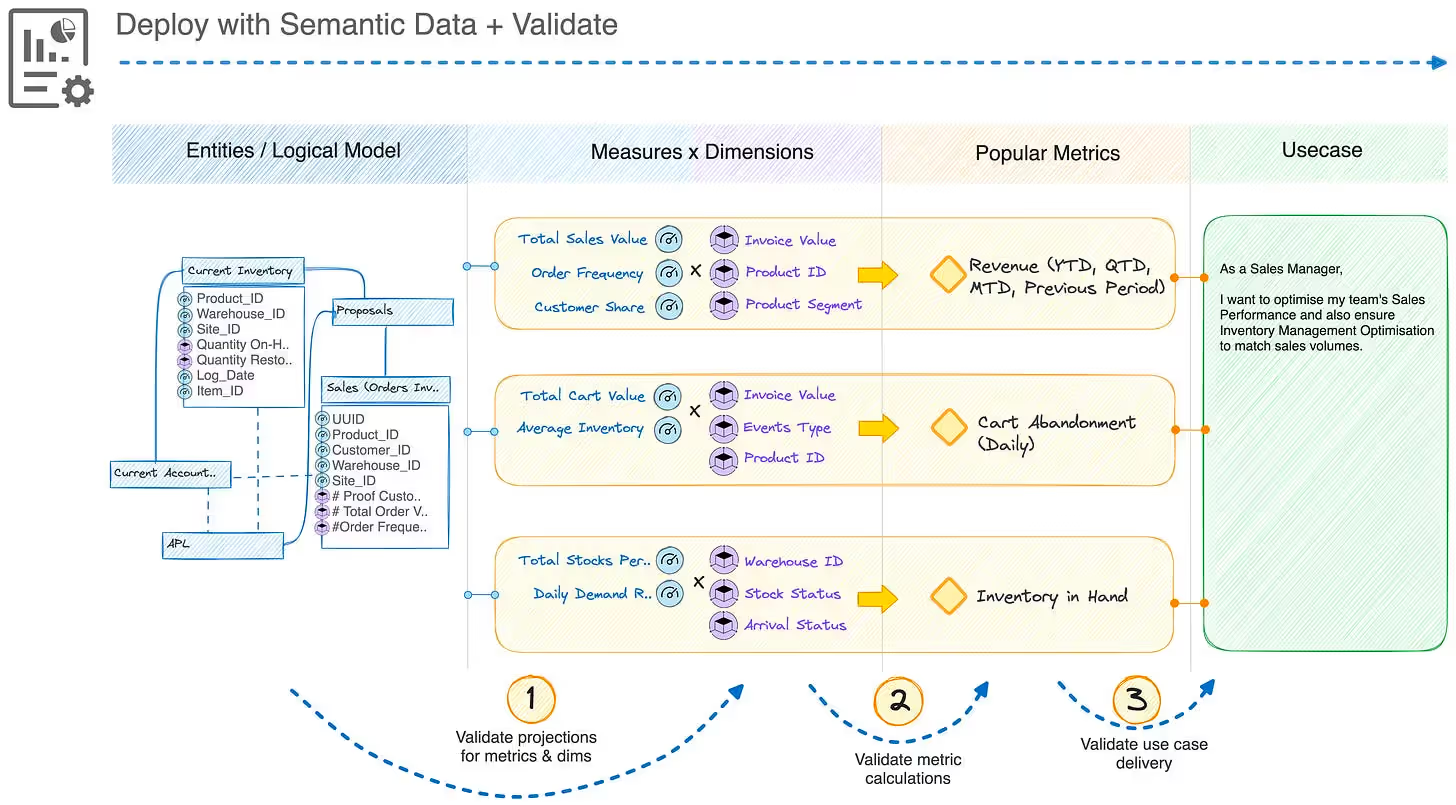
TABLE OF CONTENT


Features are a dime a dozen! Today's products often become a dumpyard of features. But do the users even want those features? An abundance of features might not always result in a positive experience.
Users are increasingly hooked on products with great user experiences. In a recent study, Forbes estimated that 86% of buyers would pay more for a great customer experience. This changing user perspective, where the customer journey and experience are more crucial than the product and its features, makes it a must to become experience-first.

This has popularised usage analytics that helps to address the widening gap between the product and its users (or user experience). The gap is most often created as product teams fail to involve the users in stable and scalable feedback loops, often due to established practices or a traditional mindset. With time, this gap widens, and the product value keeps depreciating.
The root purpose of usage analytics is to gauge different user behaviour patterns across different product interfaces, detect anomalies and bottlenecks, and address this gap. Unfortunately, as relatable to most consumers of user data we have explored, most existing solutions and practices present a series of shortcomings, as a result of which this gap never narrows or sometimes even widens.
An extremely ubiquitous problem witnessed across different solutions is that they wish to be a one-sie-fits-all. But that can seldom be the practical option unless you make your solutions modular and customisable, allowing its users to use them in a personalised manner. We’ll go into this in-depth in later parts of this article.
Let’s first understand how and why usage analytics in enterprises are falling short.

Put yourself into the shoes of a product analyst who wants to analyse the usage of an e-commerce app, for example. As a product analyst, you need to measure and monitor the product’s performance in terms of its user experiences, understand, create, and evaluate metrics, provide timely insights, and produce reports that can be used as input for making business decisions and improving the product.
Now, here’s where you might be stuck in the mud!
An app or a product has a diverse user base that interacts with it in multiple ways. To understand these diverse user actions, an analyst needs to measure a large number of metrics across different user interfaces. Now, every metric will have multiple KPIs associated with it.
So, while you go out to invest in that one (or multiple) solution/s for usage analytics, you either
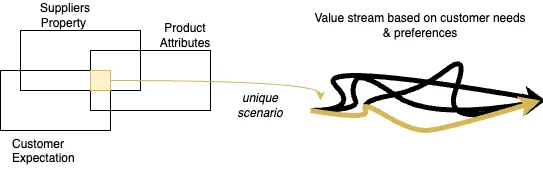
Would you want to buy a box of 4 assorted cheesecakes when you only want 2 New York Cheesecakes 🍰 and 1 Blueberry Cheesecake 🫐? That’s what most solution providers are doing today.
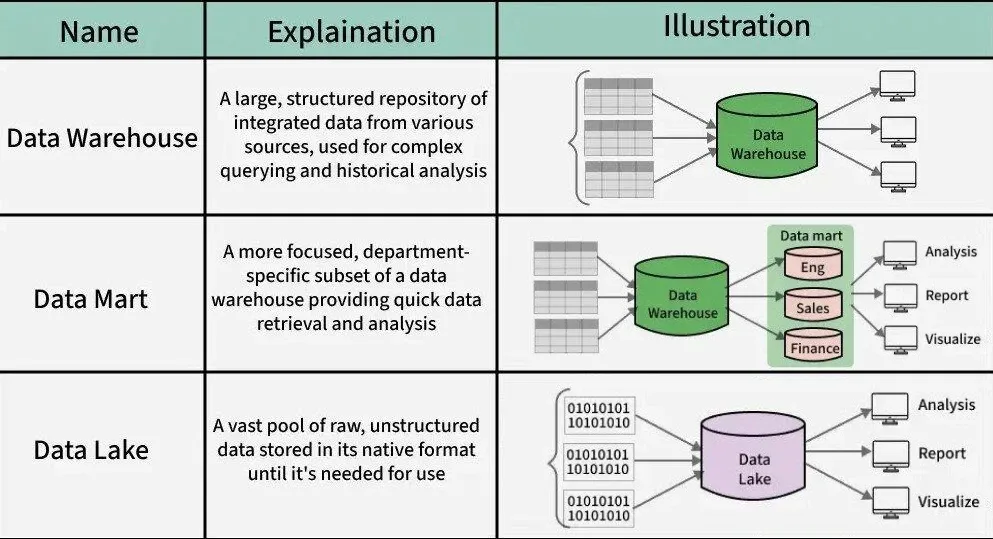
Your organisation might already have invested in a data warehouse to store data in an organized manner and also have a premium data visualisation solution. You only need a solution for, say, semantic modelling, data extraction, or data activation now.
But most user analytics solutions will offer you the complete (locked-in) stack that comprises capabilities for collecting data, storing data, and visualising it. The limitation of this is that they work with specific sources or allow data projection into locked-in apps—mostly their own data-sharing channels with restricted activation options or their own data views or models, which are locked in and cannot be read by other tools, making past investments redundant or demanding new ones.
This approach is disruptive and highly limiting for data who’s nature is to reside in multiple facets of any organisation or customer. Any form of vendor lock-in or limitation in the ability to interface with different existing entities of the data stack creates huge friction in positioning data for value.
So, you end up paying much more for bundled capabilities that you don’t even require to facilitate usage data in a healthy and reliable way. Not to forget, the more tools and solutions, the higher the maintenance and operational costs.
The data team aims to address various queries swiftly, yet they face challenges due to extensive time spent on repairing data pipelines following operational database alterations.
With limited time, they have to navigate the complexities of acquiring and comprehending domain-specific data. Each query necessitates domain knowledge to provide meaningful insights, making it challenging.
After you have onboarded the solutions, you’ll now expect smooth operations. But as we mentioned in the earlier instance, most times, it will not be a cakewalk.
For example, the user data is extracted and stored in selected warehouses or data lakes, say Snowflake. Now, the analyst, for example, goes into repeated iterations with the data engineer to use the data available as inputs for usage analytics. Using ETL pipelines, they integrate it into a central repository and create dashboards for data-driven usage insights.
By the end of this process, the business users are seen to have no or little context of the data and are disappointed with the outcome as they don’t meet the real business model in their minds. To be able to use the data, there is the additional cost and effort of learning how the data is served, the context behind different tables, columns, relationships, and so on.
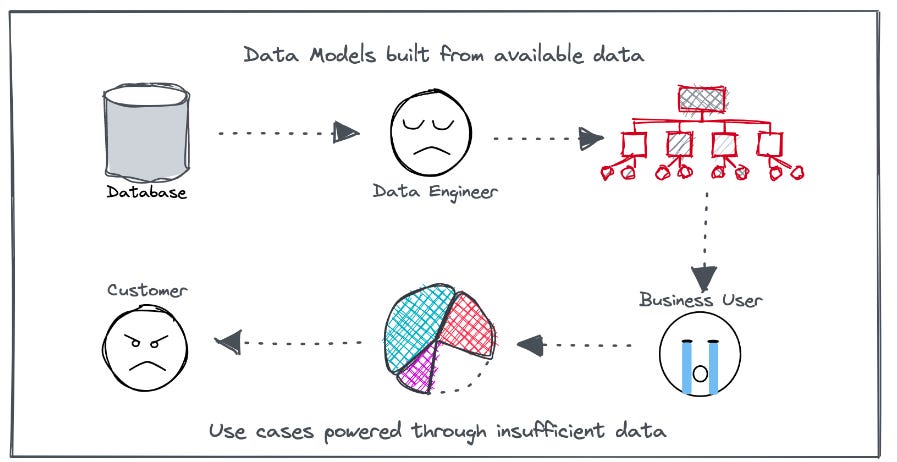
The central engineering team defines the requirements and processes, leading to inaccuracies and frustrating iterations due to their partial view of the business landscape.
Even though the analytics solution offers robust visualisations, drawing actionable insights becomes difficult due to the lack of context and a deep understanding of the story behind the graphs, charts, and other forms. This results in manual effort by the product professional, leading to product decisions based on only a partial understanding of the data.
User-related data is generated across the entire usage lifecycle of the product, which may include hundreds of interfaces, especially in our example of e-commerce. And it can be in any form and format. The major challenge is identifying what usage data should be extracted and how that can be mapped with the right application for rendering the analytics results.
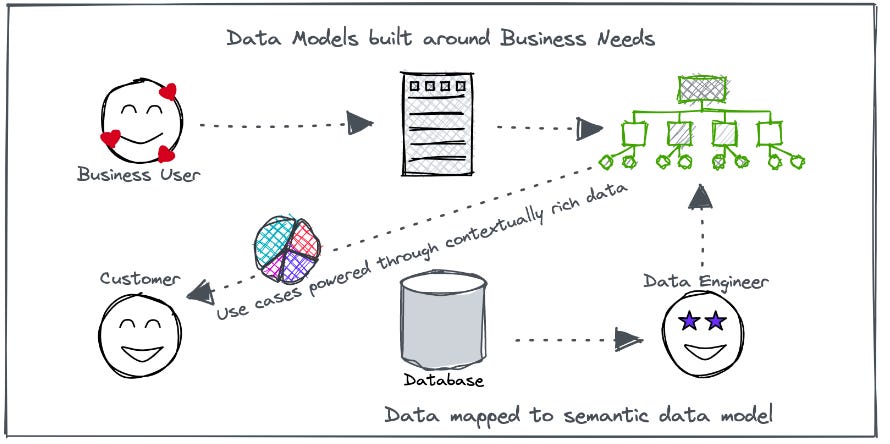
The model-first approach allows you to buy that one customised box of cheesecakes where you only have the items you desire. This is because the approach focuses on packaging and serving data tailored to specific business needs, thereby enhancing the experience of business users with regard to strong context, and also optimising resource utilisation and cost.
How does the model first approach work?
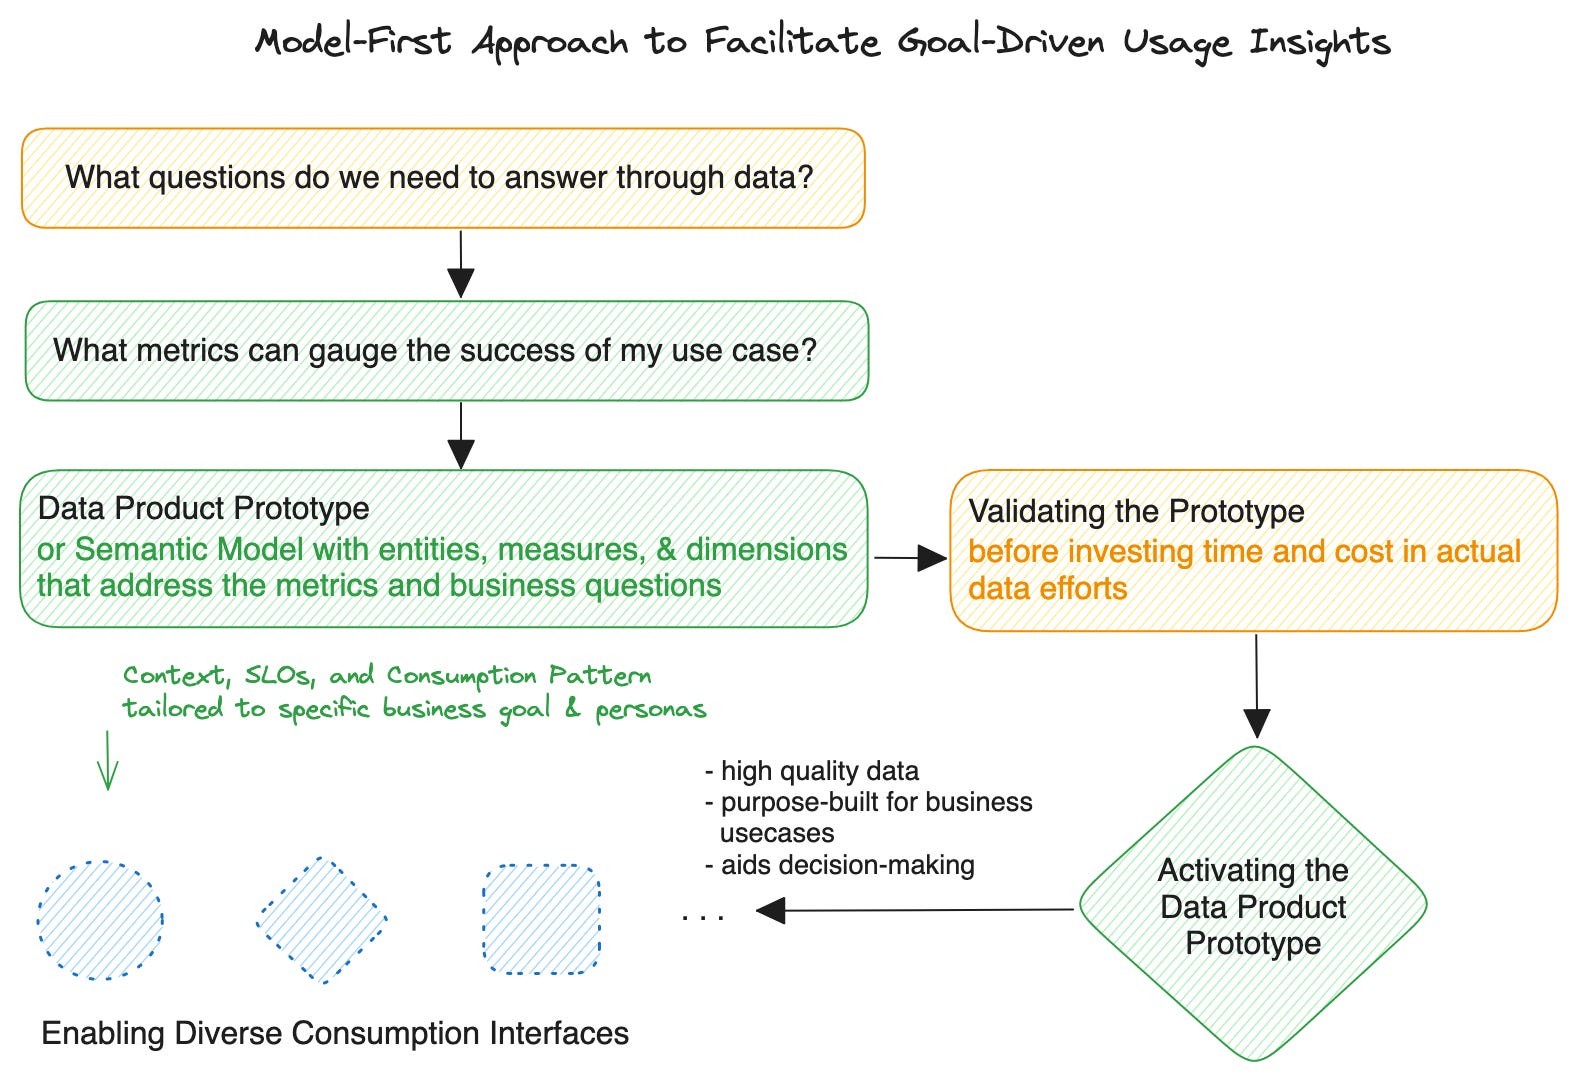
This works in an inverted manner, where outcomes are defined first
1️ User pain points are identified, and business questions are chalked out around the pain points
2️: Based on the questions, the metrics are defined, and a metric dependency tree is built with the help of a domain expert
3️: The semantic model (or the data product prototype) is prepared, where key entities, measures, dimensions, and their relationships are defined—this would address the metrics and the questions.
Note that this prototype is a very niche model with only the entities that serve the particular use case. This model ideally borrows entities from the existing core enterprise model and redefines them in the specific context of the domain and the use case. E.g., A sales funnel optimiser model or sign-up driver model
4️: The prototype is validated with mock data to severe any unnecessary cost of data transformations or mappings for mistaken models.
5️: And finally, real data is fed into the model through a self-serve platform for the data product activation.
We’ll discuss the details while returning to the problems to understand how a model-first data product for usage analytics can solve them.
A model-first approach is backed by metric-dependency trees, which are not rigid structures but like an interface that allows you to customise the final solution. This begins with questions about the business problem or use case.
By defining dependencies between key metrics, analysts and even business leaders can swiftly detect the root cause of dropping metrics or find out what’s fuelling the business's North Star goals.
📝 Learn MoreRelated read on how Metric Dependency Trees directly help your CXOs and business leaders.
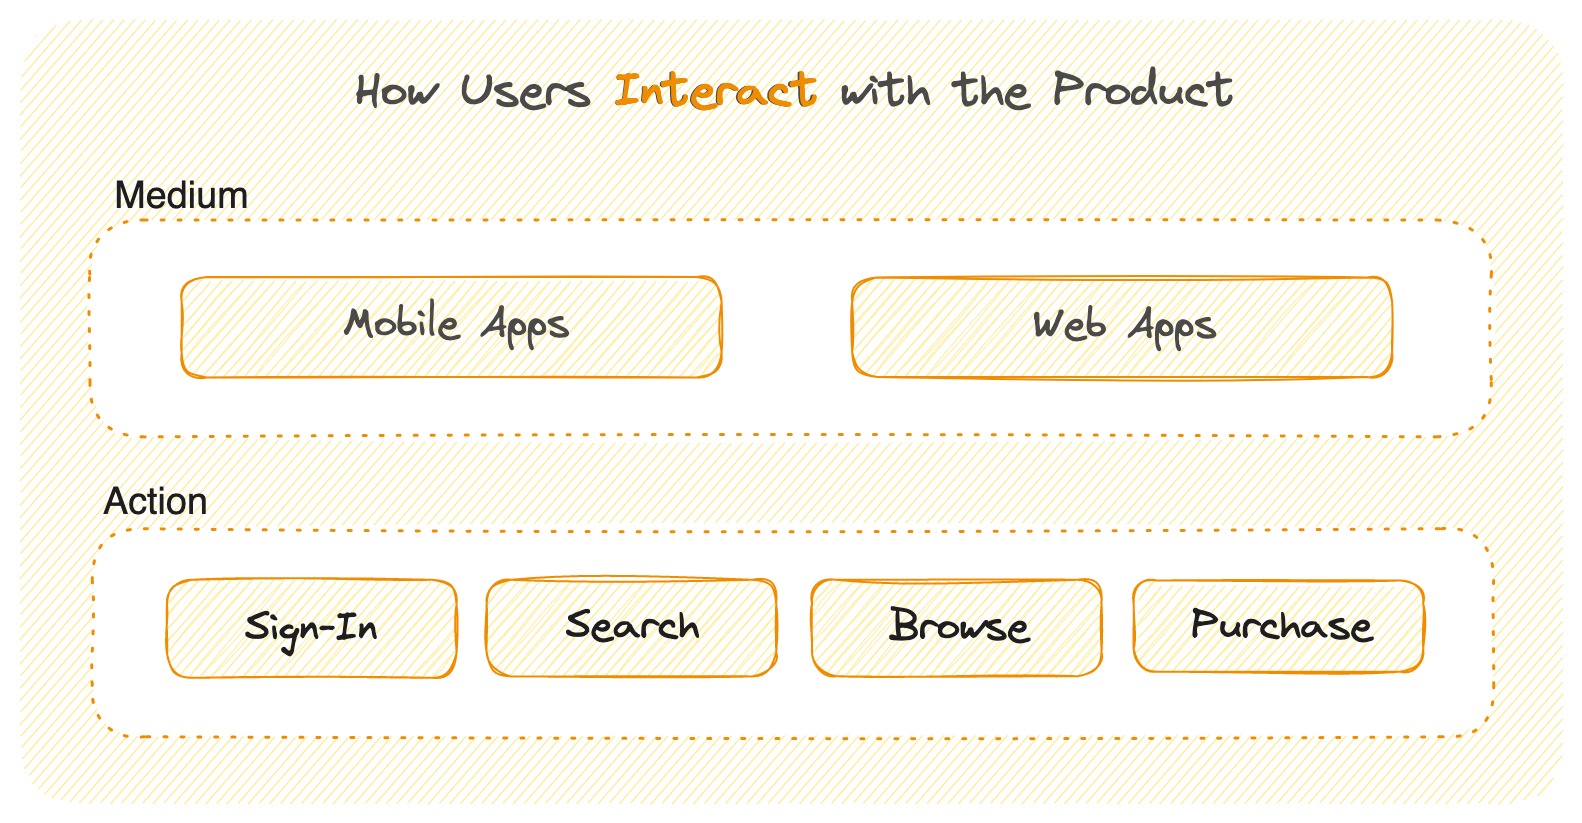
In this case, the user requirement being tracking an application’s usage analytics, we can build questions around, say, order values, time spent on the apps, sign-ups, and more, as described in the image below.
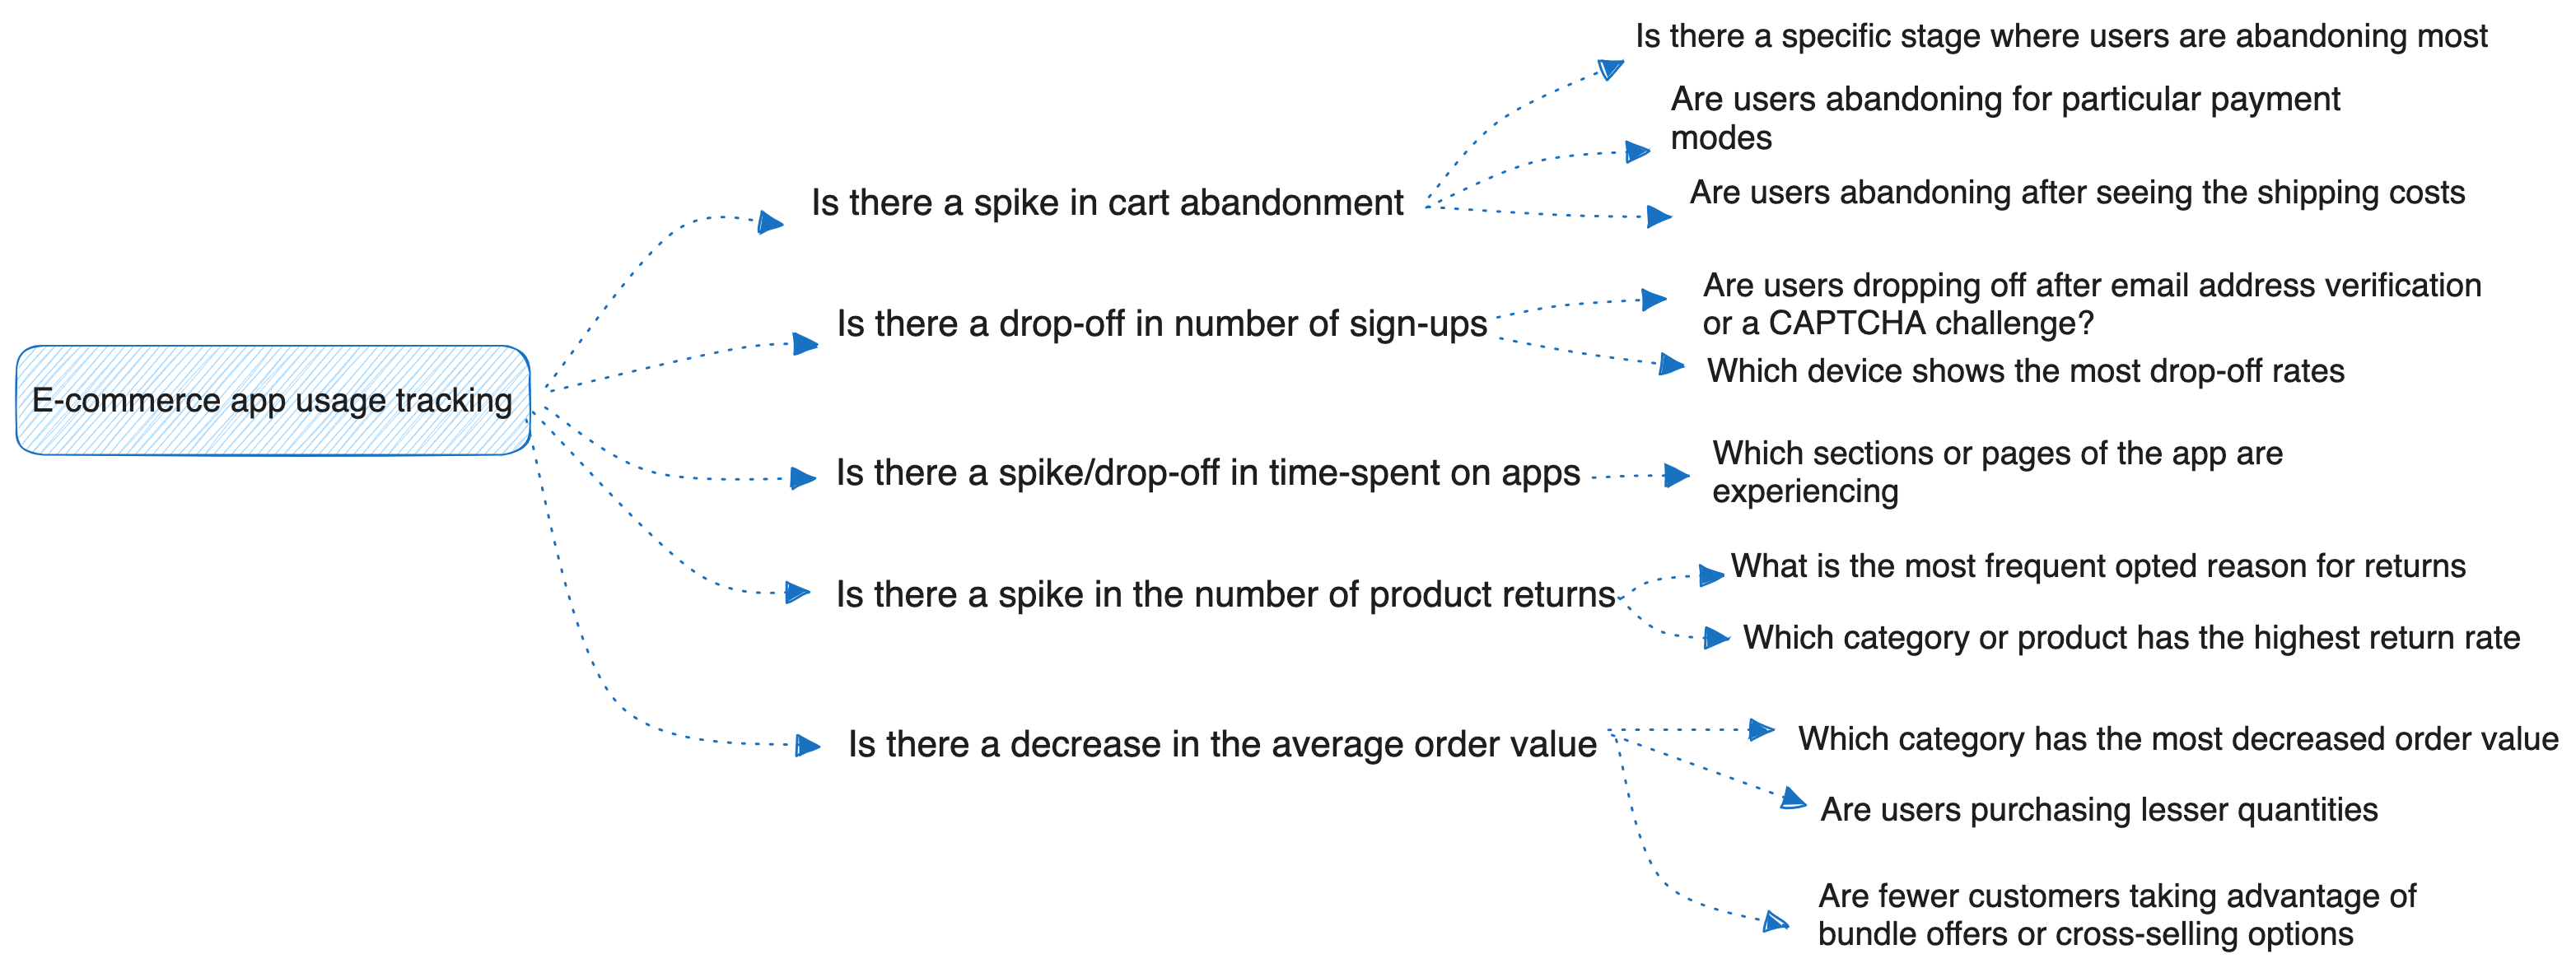
Once this in-depth list of questions is prepared, teams identify the metrics, which are consequently mapped into a business metric model.
So, what goes into the business metric model?
These metrics become one of the building blocks for building your niche data product prototype that will yield your working data product for usage analytics eventually.
This dependency tree doesn’t create any rigidity around metrics where you will be unable to define newer metrics or modify existing metrics. You define your metrics at leisure, as the model-first approach gives you complete ownership of building your own usage analytics data product.
As the owner of the data product, you can redefine metrics anytime in the future. Often, once the data product is working (activated), it progressively reveals which metrics to develop or enhance.
A model-first approach entails logical or semantic modelling that empowers enterprises to build their own data products backed by a self-serve layer.
A self-serve layer offers tool and platform-agnostic functionalities and resources to build these purpose-driven interoperable data products for all business domains.
No matter which combination of tech stack you have already invested in, the self-service layer is a layer on top of your existing stack and offers you domain autonomy.
If you already have a data warehouse, say Snowflake, you are not required to purchase the entire user analytics solution stack. Instead, the model-first approach enables you to build your semantic model (or the data product prototype) and connect to any data source through an input port built on the self-serve platform to activate your usage analytics data product.
Little break from problems to see the implementation and get more context on the efficacy of Model-First Data Products.
This first requires defining the entities that will fetch the data to answer the business questions. Every entity is further expanded through measures and dimensions, and the relationships with other entities. Let’s consider the same e-commerce app’s example:
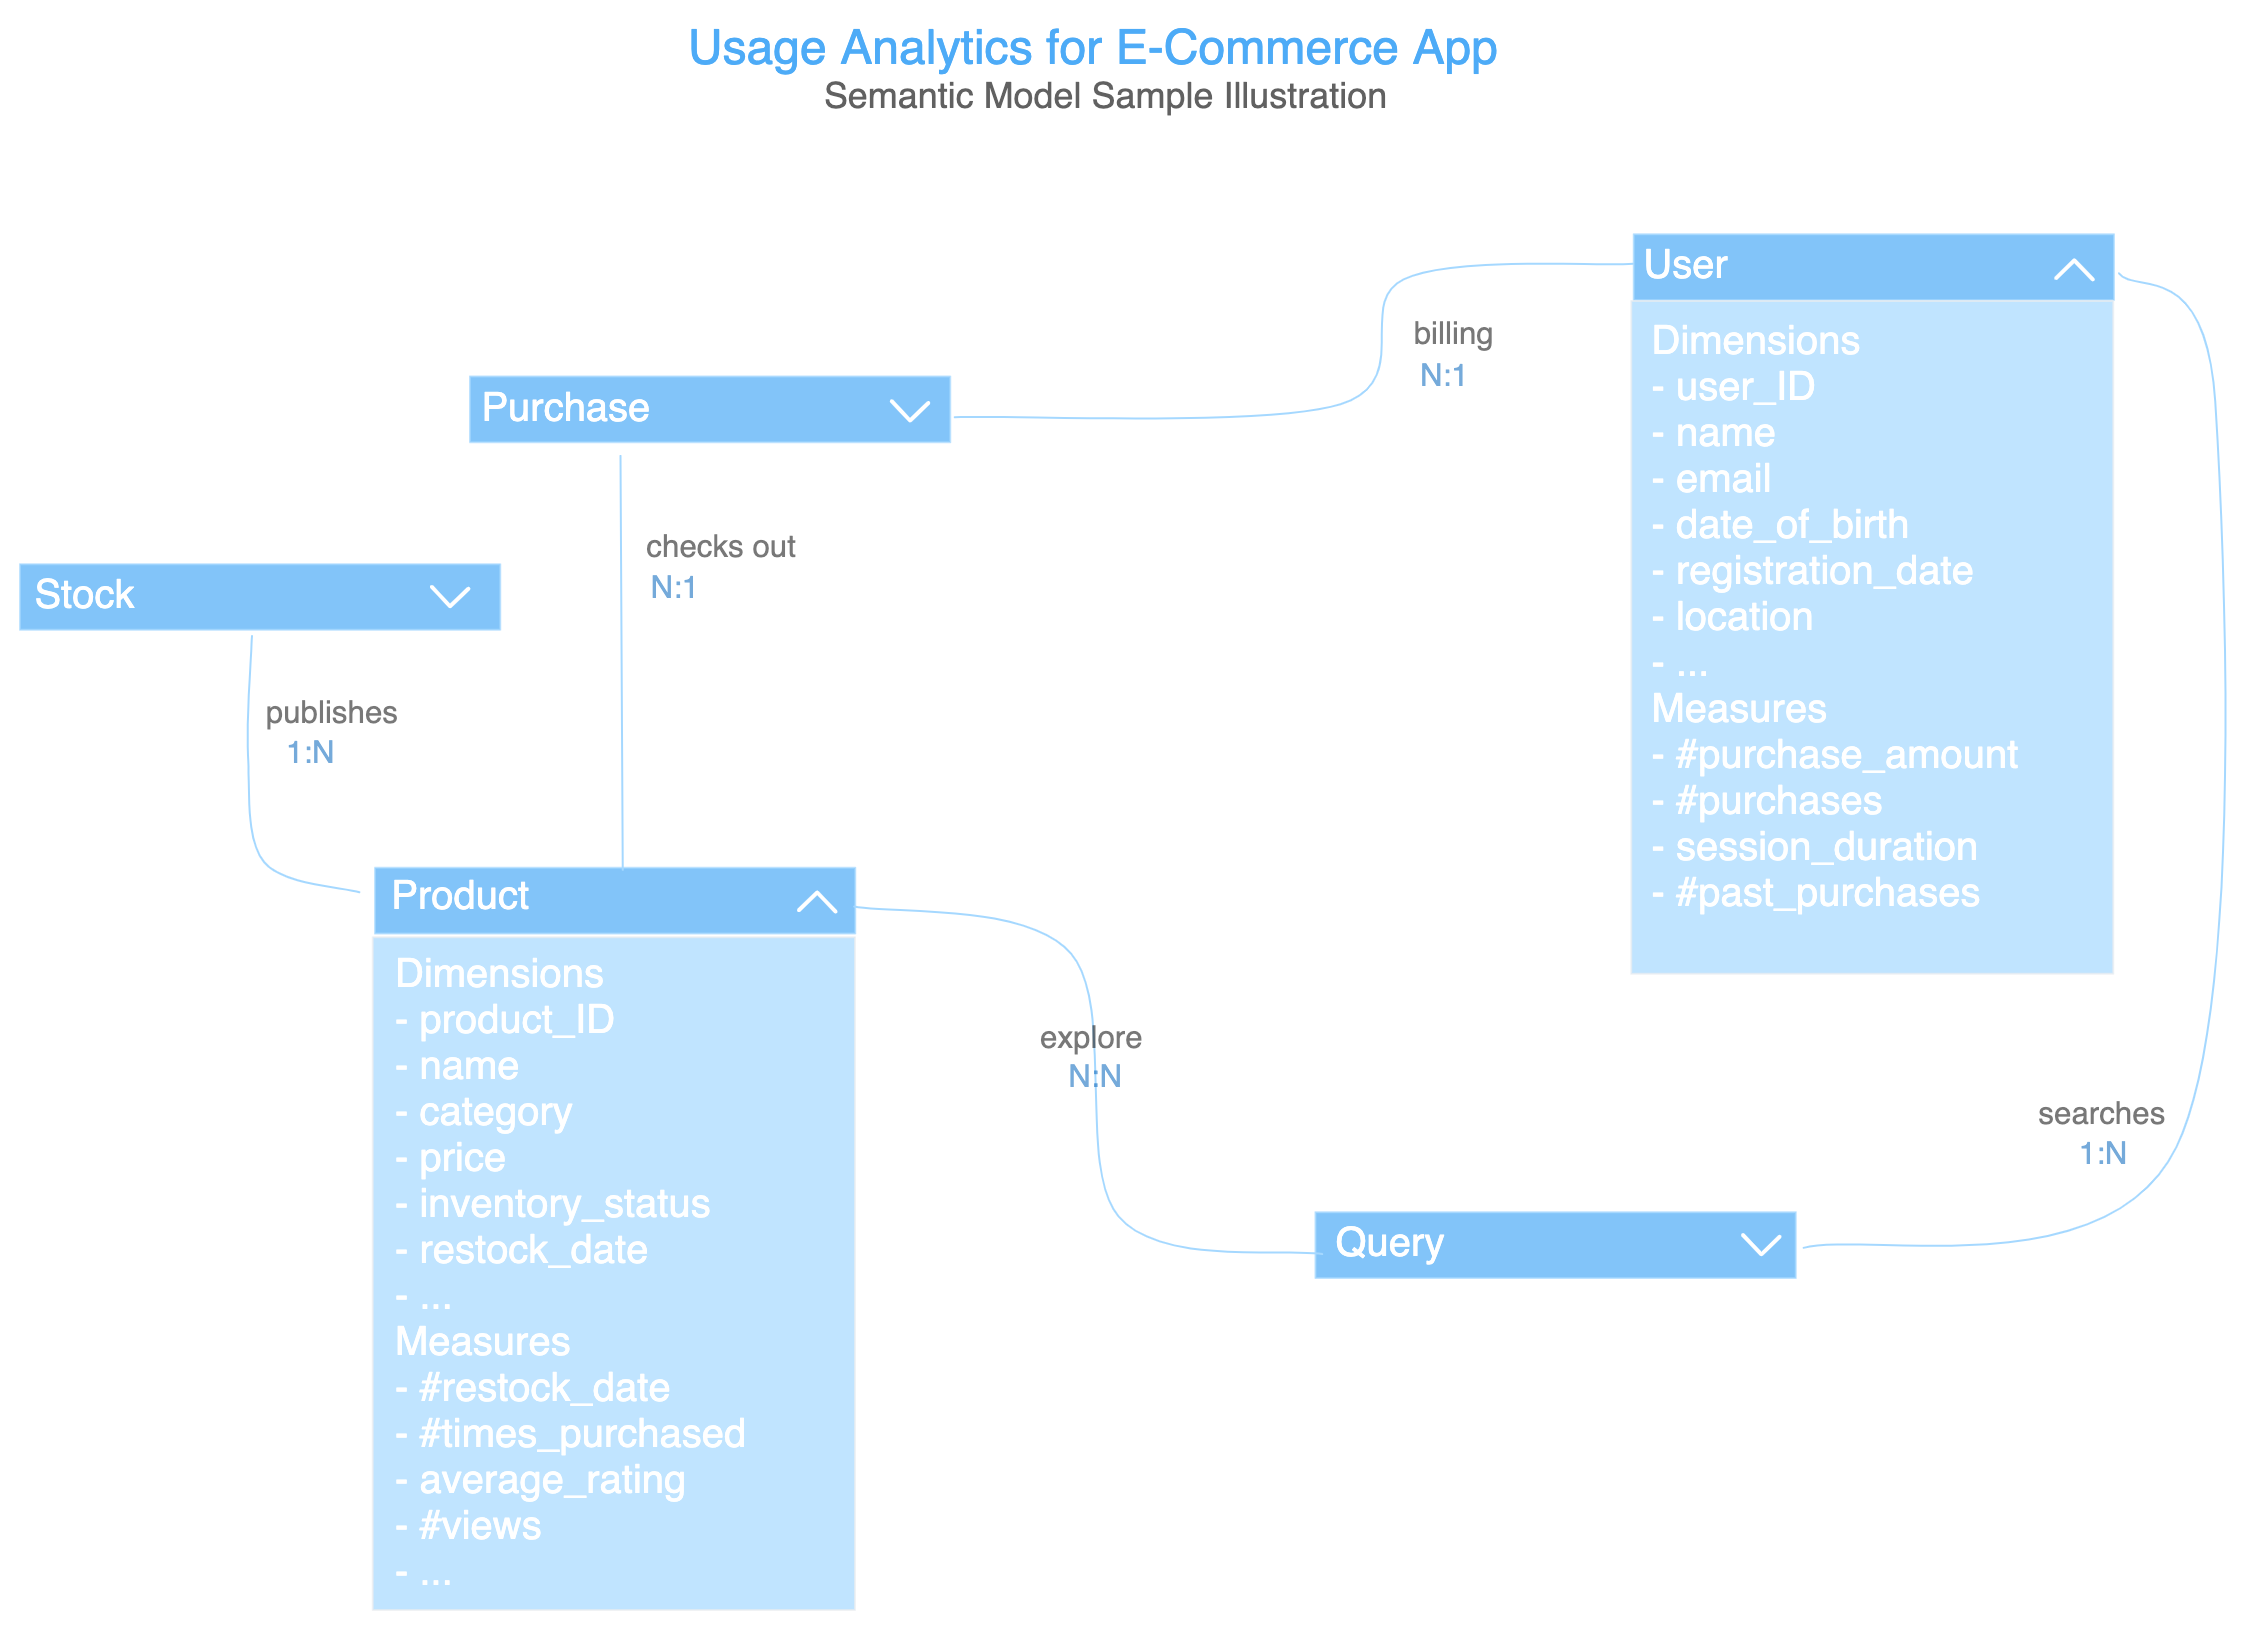
This semantic model constitutes all the aspects that the business requires. It offers a unified view of entities, measures & dimensions, the relationships and the SLOs around quality and governance.
This skeleton/model gives you the power to move, transform, and process only the data demanded by the validated prototype. So you don’t need to obtain, store, compute, and transform redundant usage data, saving the extra cost otherwise incurred when you depend only on third-party warehouses and independent solutions.
The focus in a model-first approach shifts from immediate data availability to defining the desired outcomes and business goals first. This eliminates redundant data sources and datasets, no redundant data transformations and other costly operations on all data available! Model-First approach enables the identification of only the specific data requirements necessary to achieve those goals.
This helps in:
Additionally, the semantic models are decoupled from physical data sources, so the data engineers can avoid frustrating iterations for repeatedly correcting data mapping flaws.
Once the prototype is validated, you can now feed the real-time data to activate the data product. Businesses can leverage this to run different queries on top of the data product without the underlying complexities of joining tables, catering to multiple data sources, securing different governance policies and much more.
The MDP acts as the "Single Point of Truth" for your specific use case’s data. This allows business and non-technical users to explore and understand it through the data product prototype seamlessly. Data from various sources can be integrated without physical movement and correlated in real-time for easier usage analytics.
Additionally, with domain ownership that a model-first approach offers, every domain can visualize the analytical data through their preferred consumption interfaces, which can be dashboards, alerts, and reports.
There is a clear distinction between the analytical capabilities you get from stack solutions and those from data products. Analytical capabilities enable domain teams to build data models for informed decision-making, with capabilities for self-service analytics with functions for data ingestion, storage, querying, and visualization. Data products offer the advantage of providing each domain team with its own isolated space within the platform.


Your Copy of the Modern Data Survey Report
Better decisions start with shared insight.
Pass it along to your team →
.avif)


8+ years experience in Product Management. Passionate about creating data centric products providing first class user experience.

Enabling evidence-based, proactive decisioning for data practitioners through Insights on Data Product Usage and ROI. I live in the world of metrics, and am a proponent of model-first thinking to solve the most pressing problems in data and beyond. I'm also a gluttonous consumer of the philosophy behind products, technology, civilization and culture, alongside being an avid football fan and techno-optimist!

Ritwika is part of Product Advocacy team at Modern, driving awareness around product thinking for data and consequently vocalising design paradigms such as data products, data mesh, and data developer platforms.

Find more community resources

Find all things data products, be it strategy, implementation, or a directory of top data product experts & their insights to learn from.
Connect with the minds shaping the future of data. Modern Data 101 is your gateway to share ideas and build relationships that drive innovation.
Showcase your expertise and stand out in a community of like-minded professionals. Share your journey, insights, and solutions with peers and industry leaders.


