

Access full report
Oops! Something went wrong while submitting the form.

🤍

Facilitated by The Modern Data Company in collaboration with the Modern Data 101 Community
Latest reads...
.png)
.png)
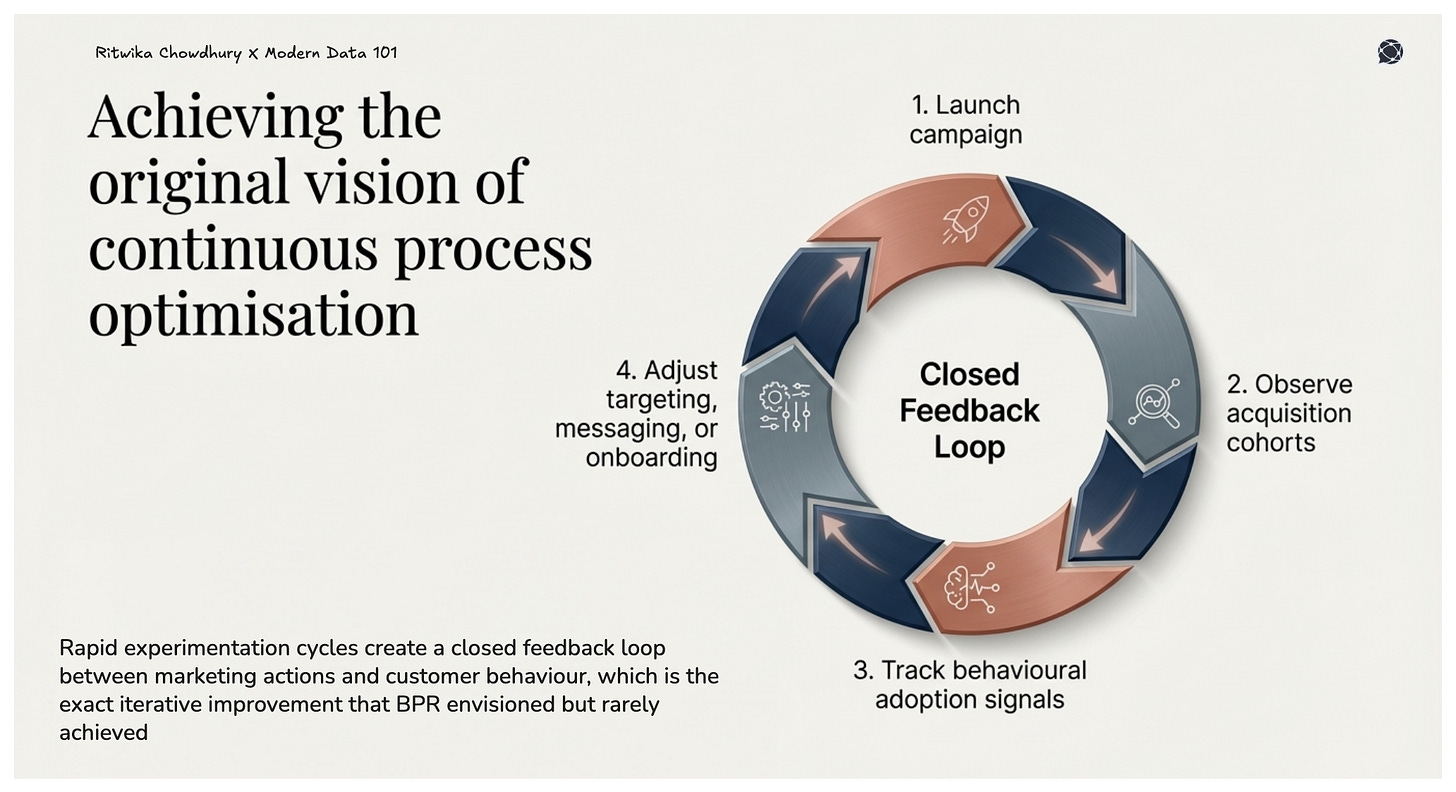
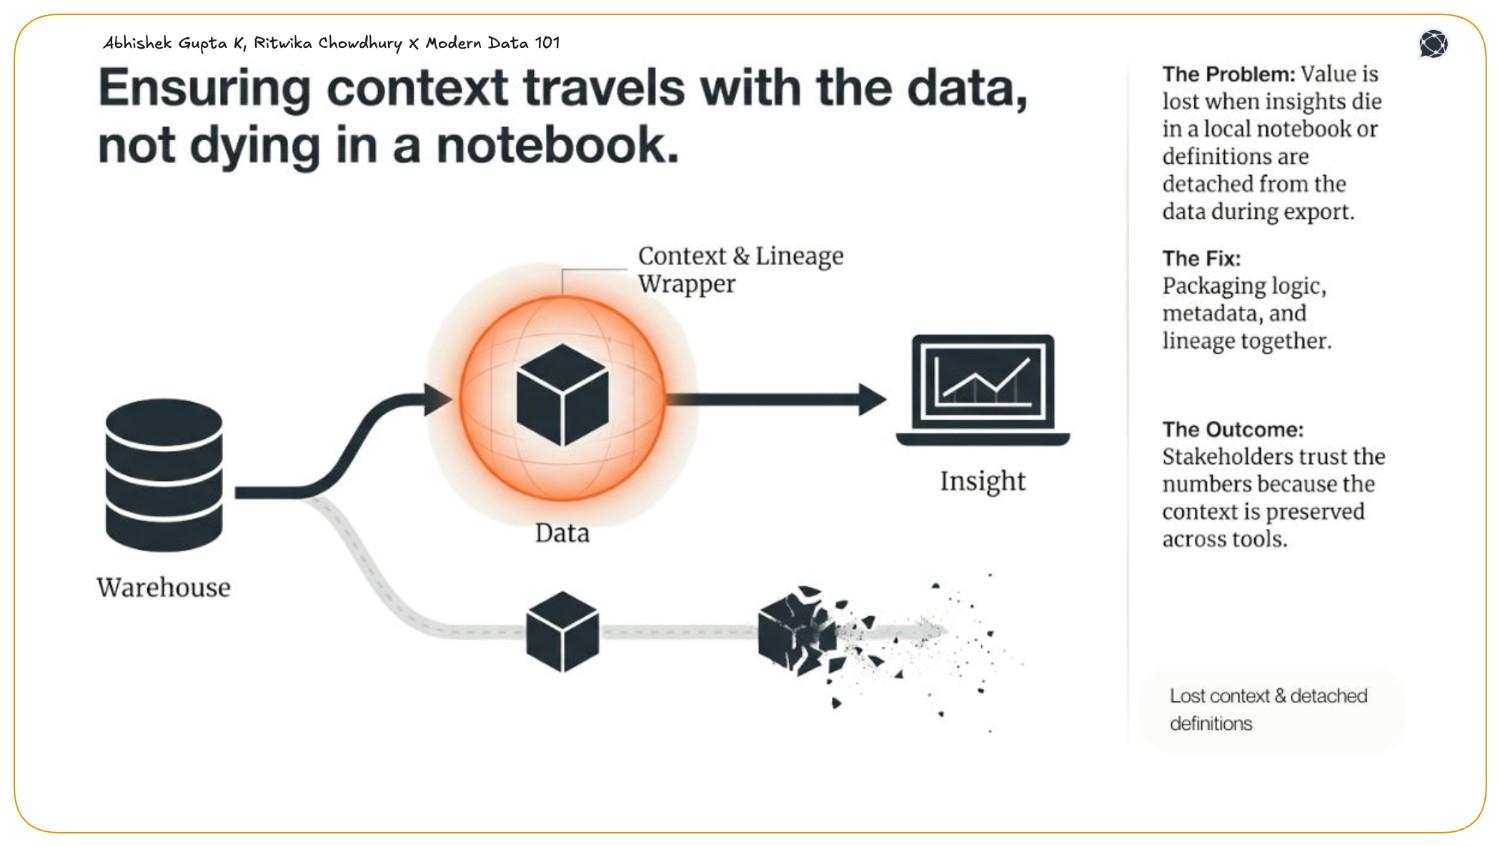
TABLE OF CONTENT


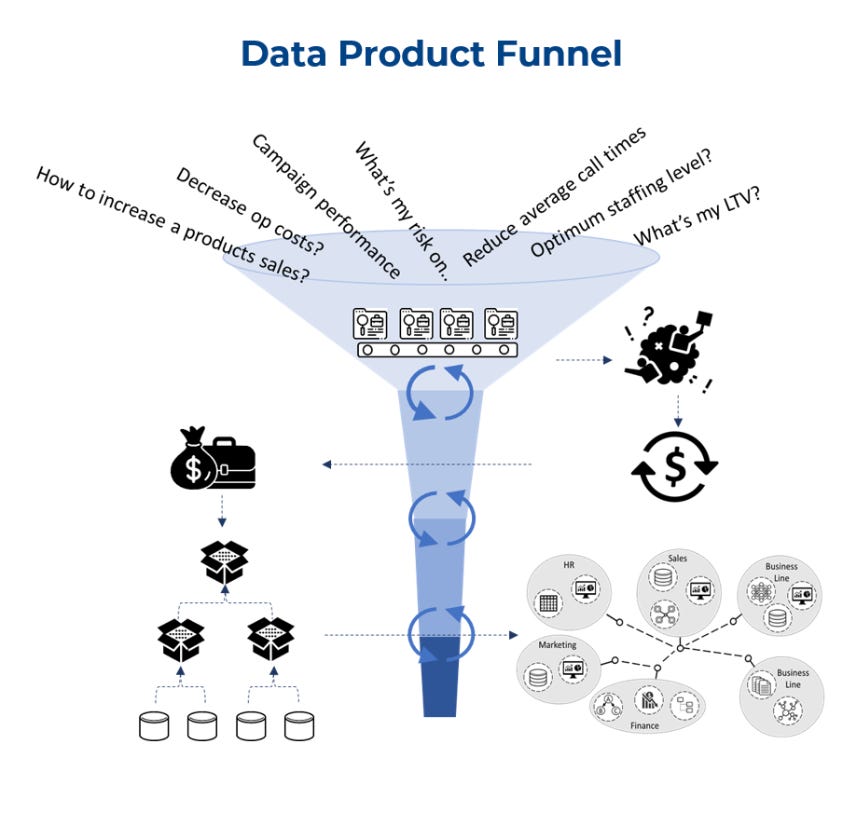
"AI as the new Electricity” has been evangelised by Andrew NG and the data community from a transformational point of view.
“Just as electricity transformed almost everything 100. years ago, today I actually have a hard time thinking of an industry that I don’t think AI will transform in the next several years.” - Andrew NG
But in fact, in a more literal sense, Data is the new Electricity. It flows and enables “appliances”- literally, as well as in the analogy of digital applications and decisions.
The Data Product Strategy is based on the successful models developed around harnessing the power of electricity. The ideation process has been bottom-up: which means this context was looked up after the strategy naturally came together and aligned to these models as they intrinsically fit the true nature or essence of data. The context of "Data as the new electricity" puts a good wrapper around the strategy and brings the story together.
If these proven stable models, which have been unleashed across the globe after several rounds of evolution, are able to regulate something so volatile and chaotic as electricity to scale it as a serpentine commodity running all around us without really suggesting a constant presence, these approaches would prove to be concrete for data as a commodity.
1. Business Opportunity / Supply Gap
2. Use Case Identification
3. Metric Model: Identification of metrics and relations
4. Metric Enablement Model
5. Data Product Top-to-Bottom Requirements
6. Bottom-to-Top Development + Iteration
7. Metric Validation
8. Deployment
9. Continuous Metric Iteration
Optimal Key to Data Product Success
1. The ideal reference/wireframe for product creation
2. Direct wireframe of business goals - direct correlation
3. More stable & consistent compared to underlying data
4. Comprehensible and manageable by business teams
5. Low friction to culture transition
A metric model is more stable and consistent with business needs compared to the underlying data. It makes the ideal reference or wireframe for product ideation and creation. While any product requires a set of metrics that it's developed around, data requires a metric model to transition into the product state, and a list of metrics wouldn’t suffice given the spread or omnipresence of data.
A metric model provides a direct interface and has a direct correlation to business processes and goals. This also makes it more comprehensible and manageable for business teams who otherwise host significant friction against learning low-level specifics. Data Product, even though it produces clean and consumable data, has several layers of low-level specifics that are more comprehensible for product management and engineering teams. Thereafter, a model at the business level instead of at the product or data level ensures low friction to culture transition.
1. All metrics tie back to primary business goals, e.g., TTROI
2. Every node represents either a metric or a sub-metric
3. Every edge represents how each sub-metric enables or impacts a higher-order metric
4. This model is solely influenced by "business change drivers"
All metrics tie back to primary business goals, e.g. ROI, Time to Revenue, Conversion Rate, etc. Interestingly, all these metrics depend on sub-metrics that enable them. If each metric value is treated as an agreement, all the sub-metrics enabling it become low-level objectives. The way SLAs and SLOs are interrelated.
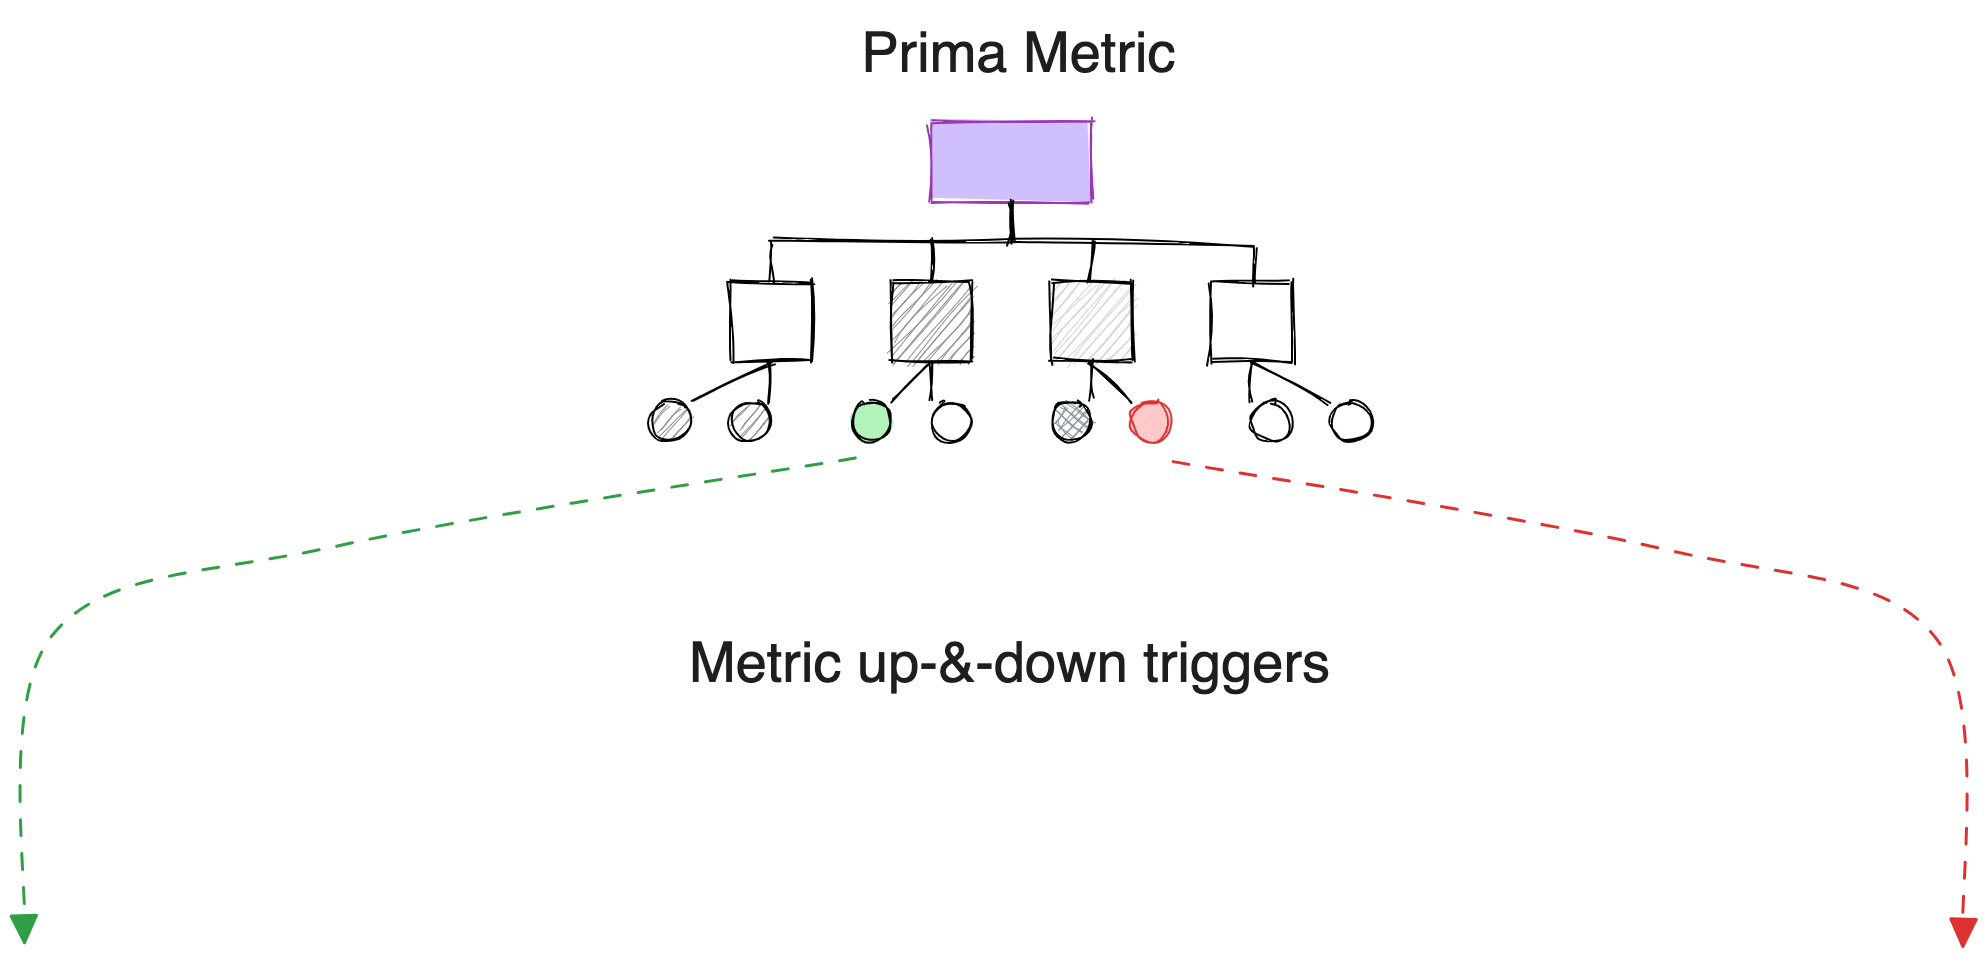
Every node in a metric represents a metric or a sub-metric. The node at the pinnacle is the prima metric or the key metric the use case or the domain wants to push, for example, ROI. Every edge conveys how a sub-metric enables or impacts a higher-order metric.
The metric model is not exposed to much change as it sits very close to business goals, which are stable unless achieved or significantly pivoted. If you recall any business use case you worked on, the primary metrics that tie back to customer-facing endpoints are extremely consistent.
There could be a bit of ruffle in downstream metrics, but these too are known to be quite consistent because at the end of each metric is, after all, one type of customer - internal or external. Every change triggers an iteration loop of communication between the metric driver and the metric beneficiary. Which is why business metrics are well thought out, chosen with care, and finalised sternly.
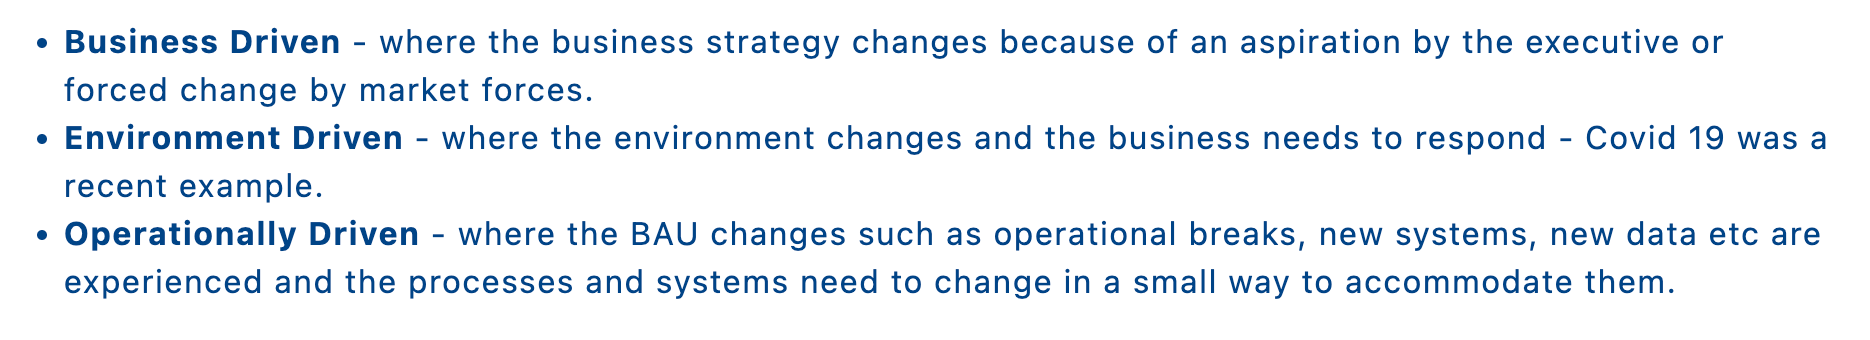
The only points of influence that inspire change in the metric model are business change drivers, which Jon Cooke summarises really well:
1. Importance of enabler metrics alongside customer-facing metrics.
2. Metric prioritisation framework to navigate dips and spikes through strategic effort and resource allocation.
Every use case has a very specific and practically very narrow set of metrics. However, if we consider all the metrics that power the topsoil, the number of metrics could easily overflow a manageable limit. In prevalent stacks, most of the sub-metrics are not identified, especially with respect to data, and the data-driven efforts toward achieving the prima metrics are largely ill-defined.
You can't improve what you don't measure. - Peter Drucker
To truly become data-driven, data-driven efforts need to become measurable. And to do it in a way that completely aligns with business objectives calls for a metric model. This implies identifying and implementing the right set of sub-metrics assigned to higher-order business metrics.
While aligning with business may seem like a natural course of action, this is not what runs in practice. The goals and metrics of data teams and related efforts are largely separated or ill-defined with respect to business goals. A metric model bridges that gap and ensures high transparency across all tracks.
To prevent any overwhelm, the metric model needs to pass through a prioritisation filter, aka a concrete product strategy. One that enables you to substantiate the ideated model with its true value proposition to prioritise the efforts behind metrics resourcefully. One is free to use any framework they deem fit for this purpose, such as, say, a Lean Value Tree, right before freezing the Metric Model. In this case, we have used the BCG framework from the Boston Consulting Group.
The BCG Framework is a growth-share matrix that sheds light on high-performing tracks, discardable tracks or ones that need consistent maintenance. It has four interesting categories, and usually, they apply to products and initiatives, but we are using them for metric prioritisation.
Below, we have explained them with respect to metrics.
In summary, with a BCG framework-based prioritisation, a metric model would enable, there is more clarity on:
💡 True Product Experience
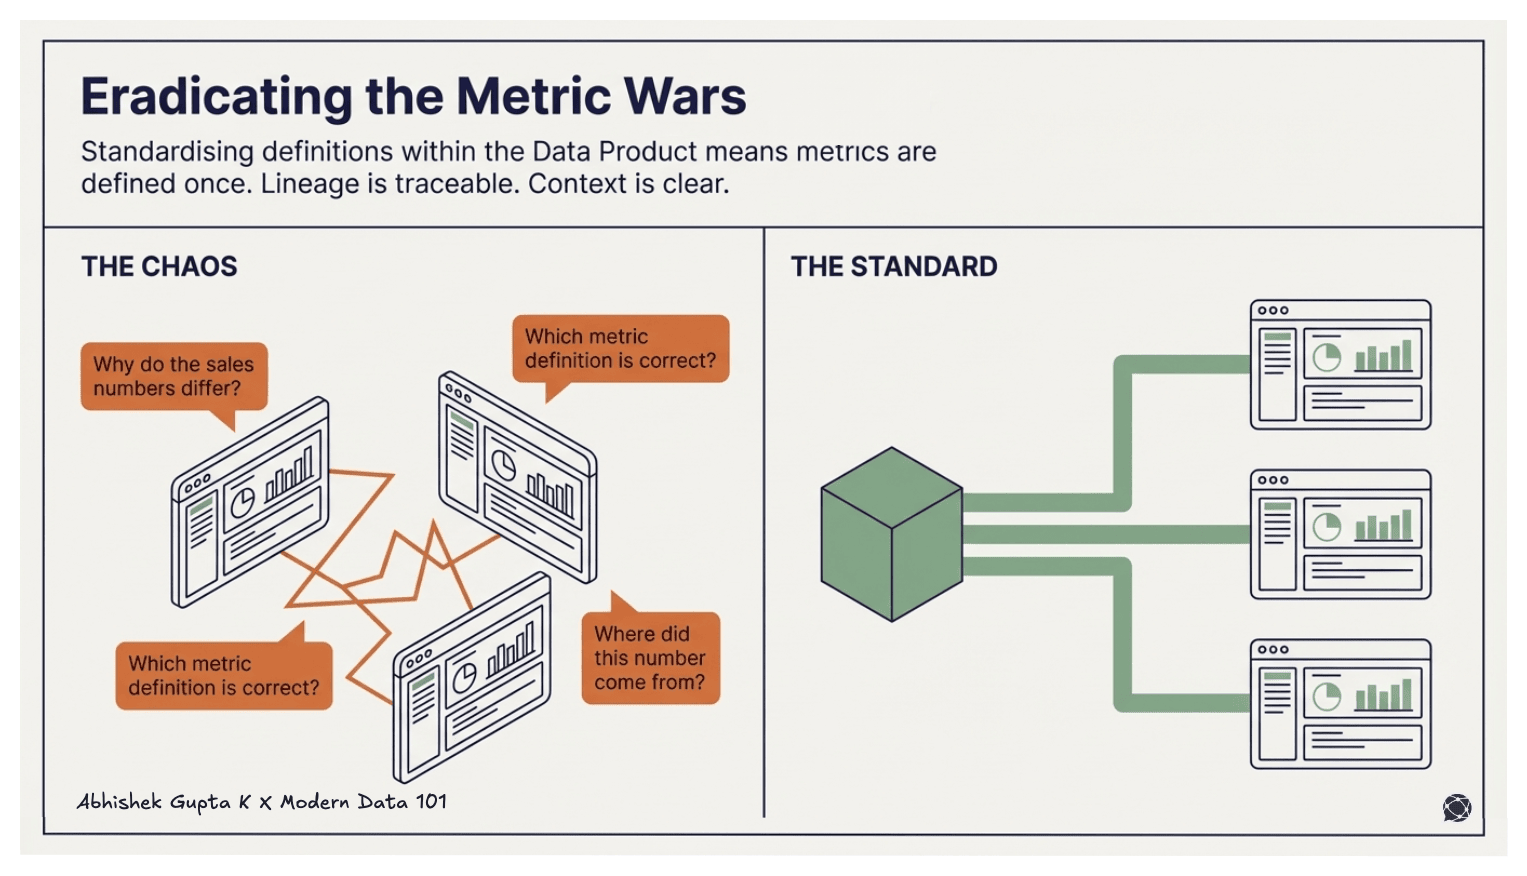
As a virtue of the metric model, inconsistency triggers, and prioritisation chain, you would know where and what to fix without navigating complex layers and illegible edges/connections in the data stack. This is the foundation of your data product - each metric is like an appliance that the data strives to light up.
You have the logical metric model. Now, how do you power it up? You need an enablement model that answers:1. How are the metrics powered?
2. How do Data Product o/p ports map to the metric model?
To answer these, we need to go back to the proven models that have been used in the context of regulating the electric flow. Models such as parallel circuits, capacitors, and resistors came after several iterations and failures. The consolidated model at the end of this evolution chain then went on to last for years due to its stability and ability to scale and regulate something as volatile and chaotic as electricity. Today, it’s all around us, quite literally, powering all our regular operations and businesses passively.
That’s exactly what we want with data, and that’s what becoming data-driven - a passive enabler deeply embedded within all our operations. We want to reach a state where we don’t have to call out data-driven decisions explicitly; all decisions would be data-driven.
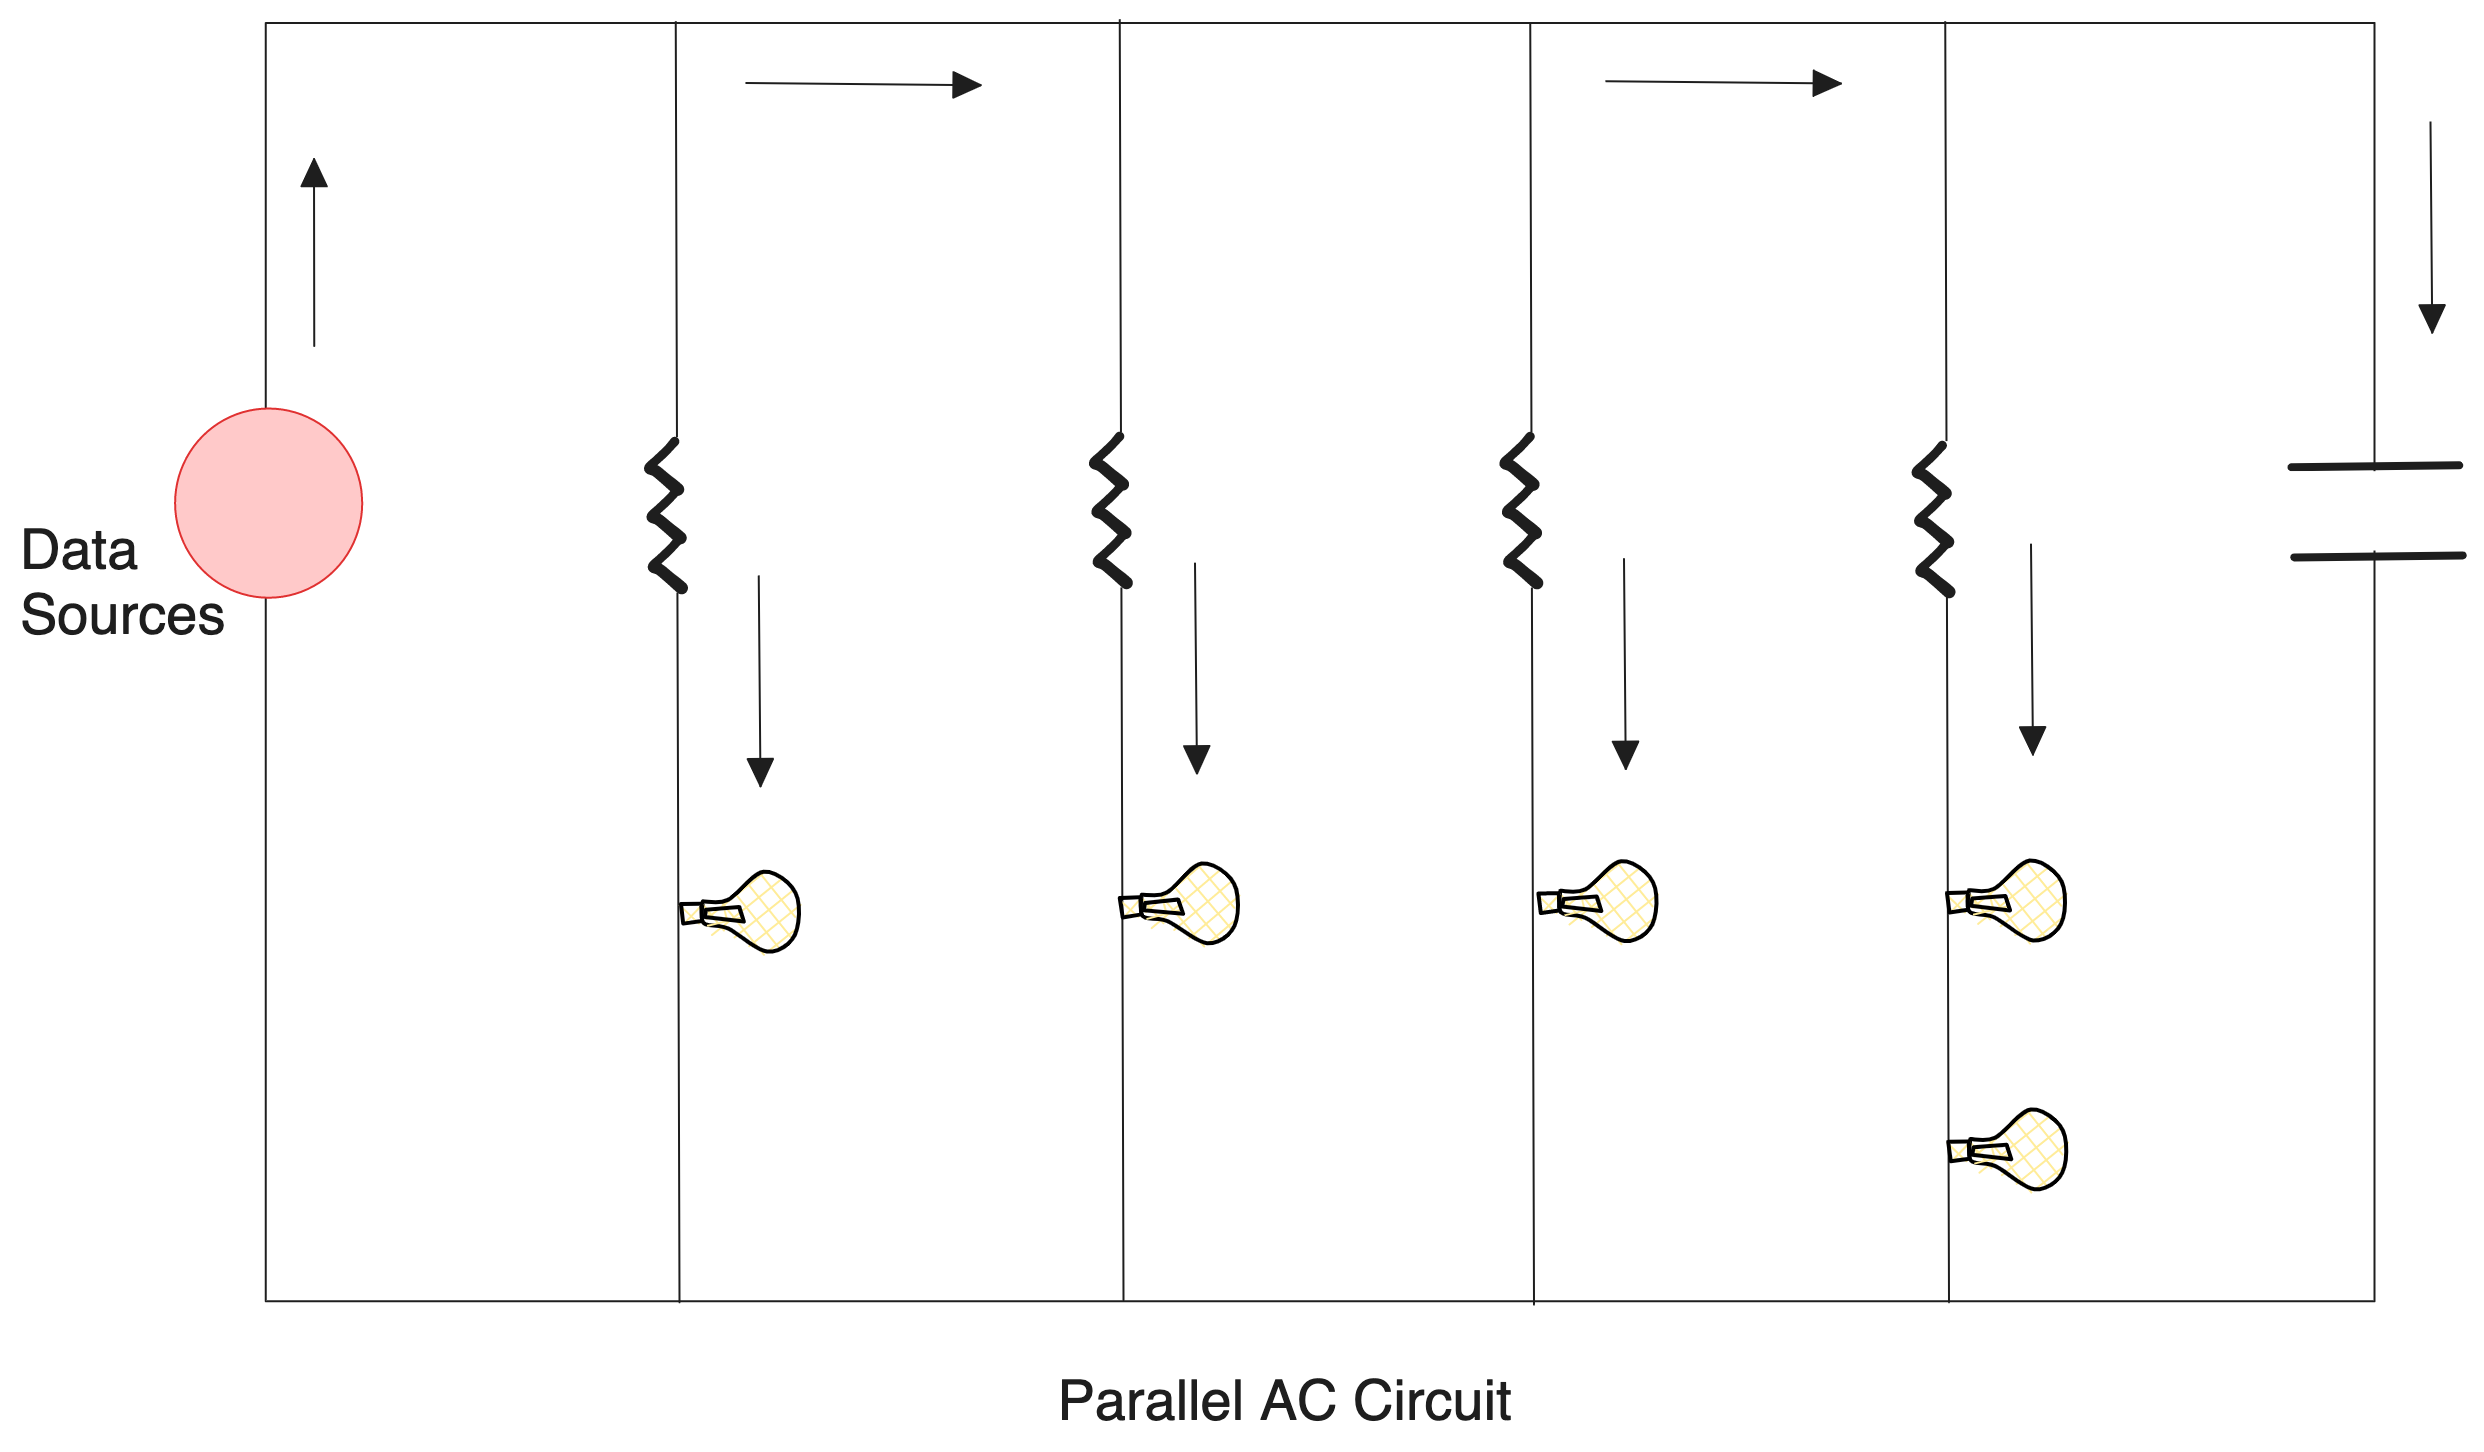
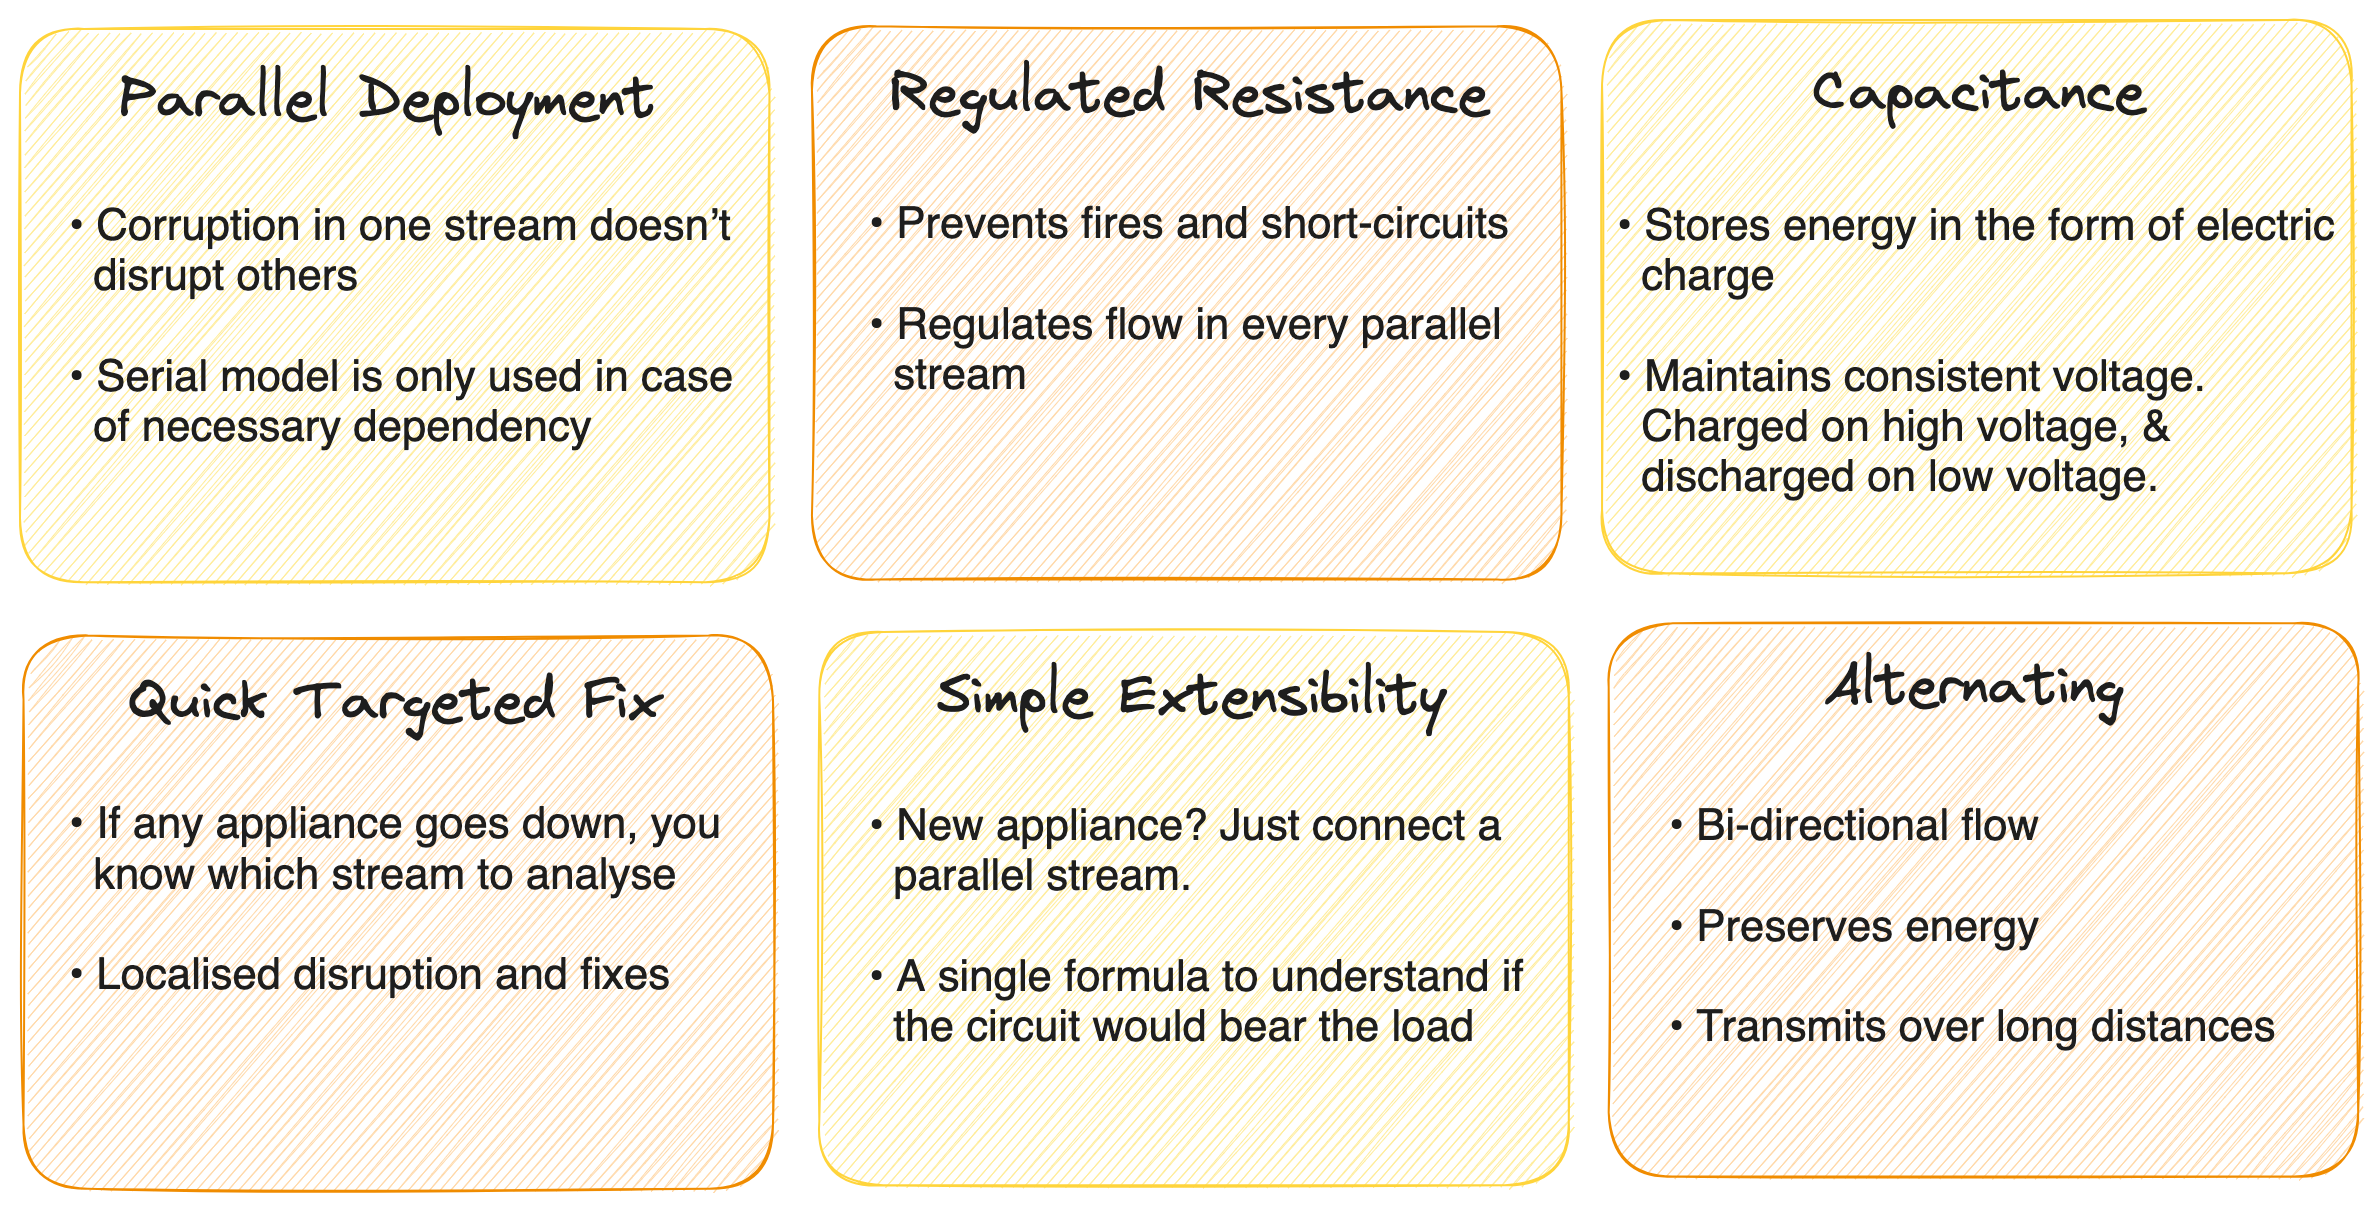
Designs employed in a parallel AC circuit:
If these proven models, which have been unleashed across the globe after several rounds of evolution, are able to regulate something so volatile and chaotic as electricity to scale it as a serpentine commodity running all around us without really suggesting a constant presence, these approaches would prove to be concrete for data as a commodity.
Let’s find out how this model translates into the realm of data.

Designs employed in a parallel metric model:
Corruption or disruptive changes in one track don't impact other tracks while not limiting the visibility of data from other tracks. Each metric enables certain decisions. Thus, the parallel model enables both decision isolation as well as collaborative decision-making. Most decisions are insulated as much as possible from sour decisions but benefit from positive ones.
Yes, data products are also driven by the principle of infra isolation and, therefore, self-dependency. This design also needs to be reflected on the metric layer that sits on top of the data products layer due to the same virtues.
💡 It’s important to remind ourselves that bringing in the product ideology means reflection across all layers or verticals, even beyond data products. Adopting a new design approach means implementing it top-down instead of limited and incomplete implementation in selected areas.
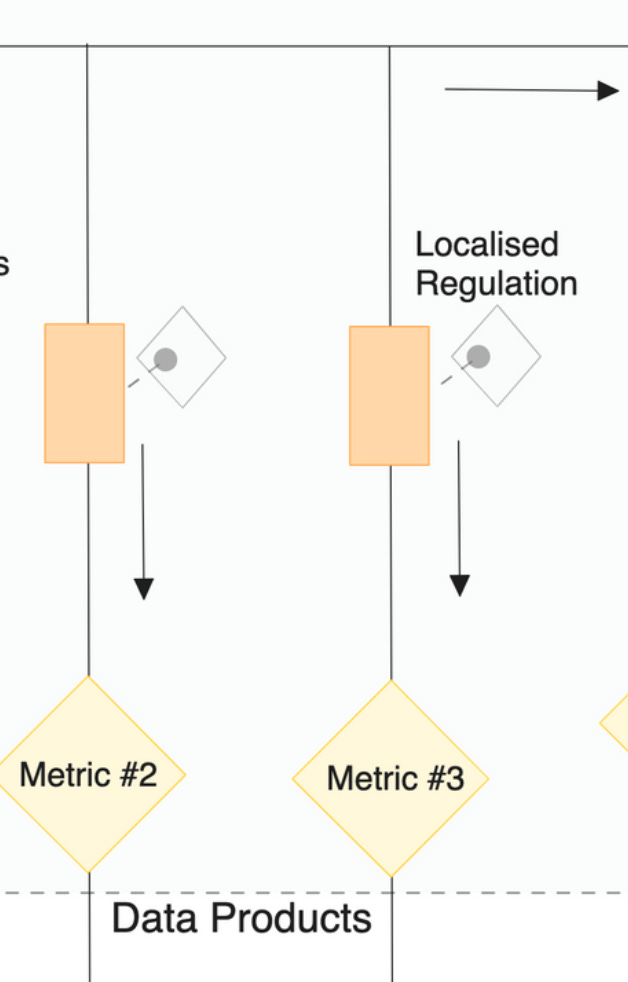
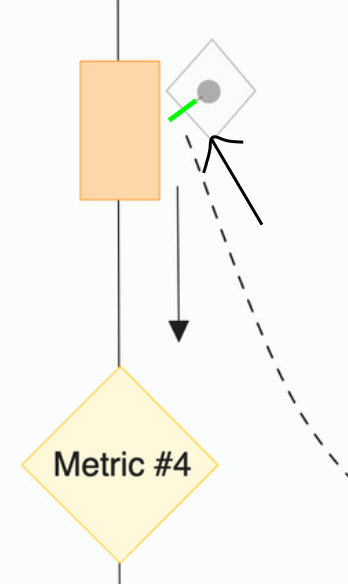
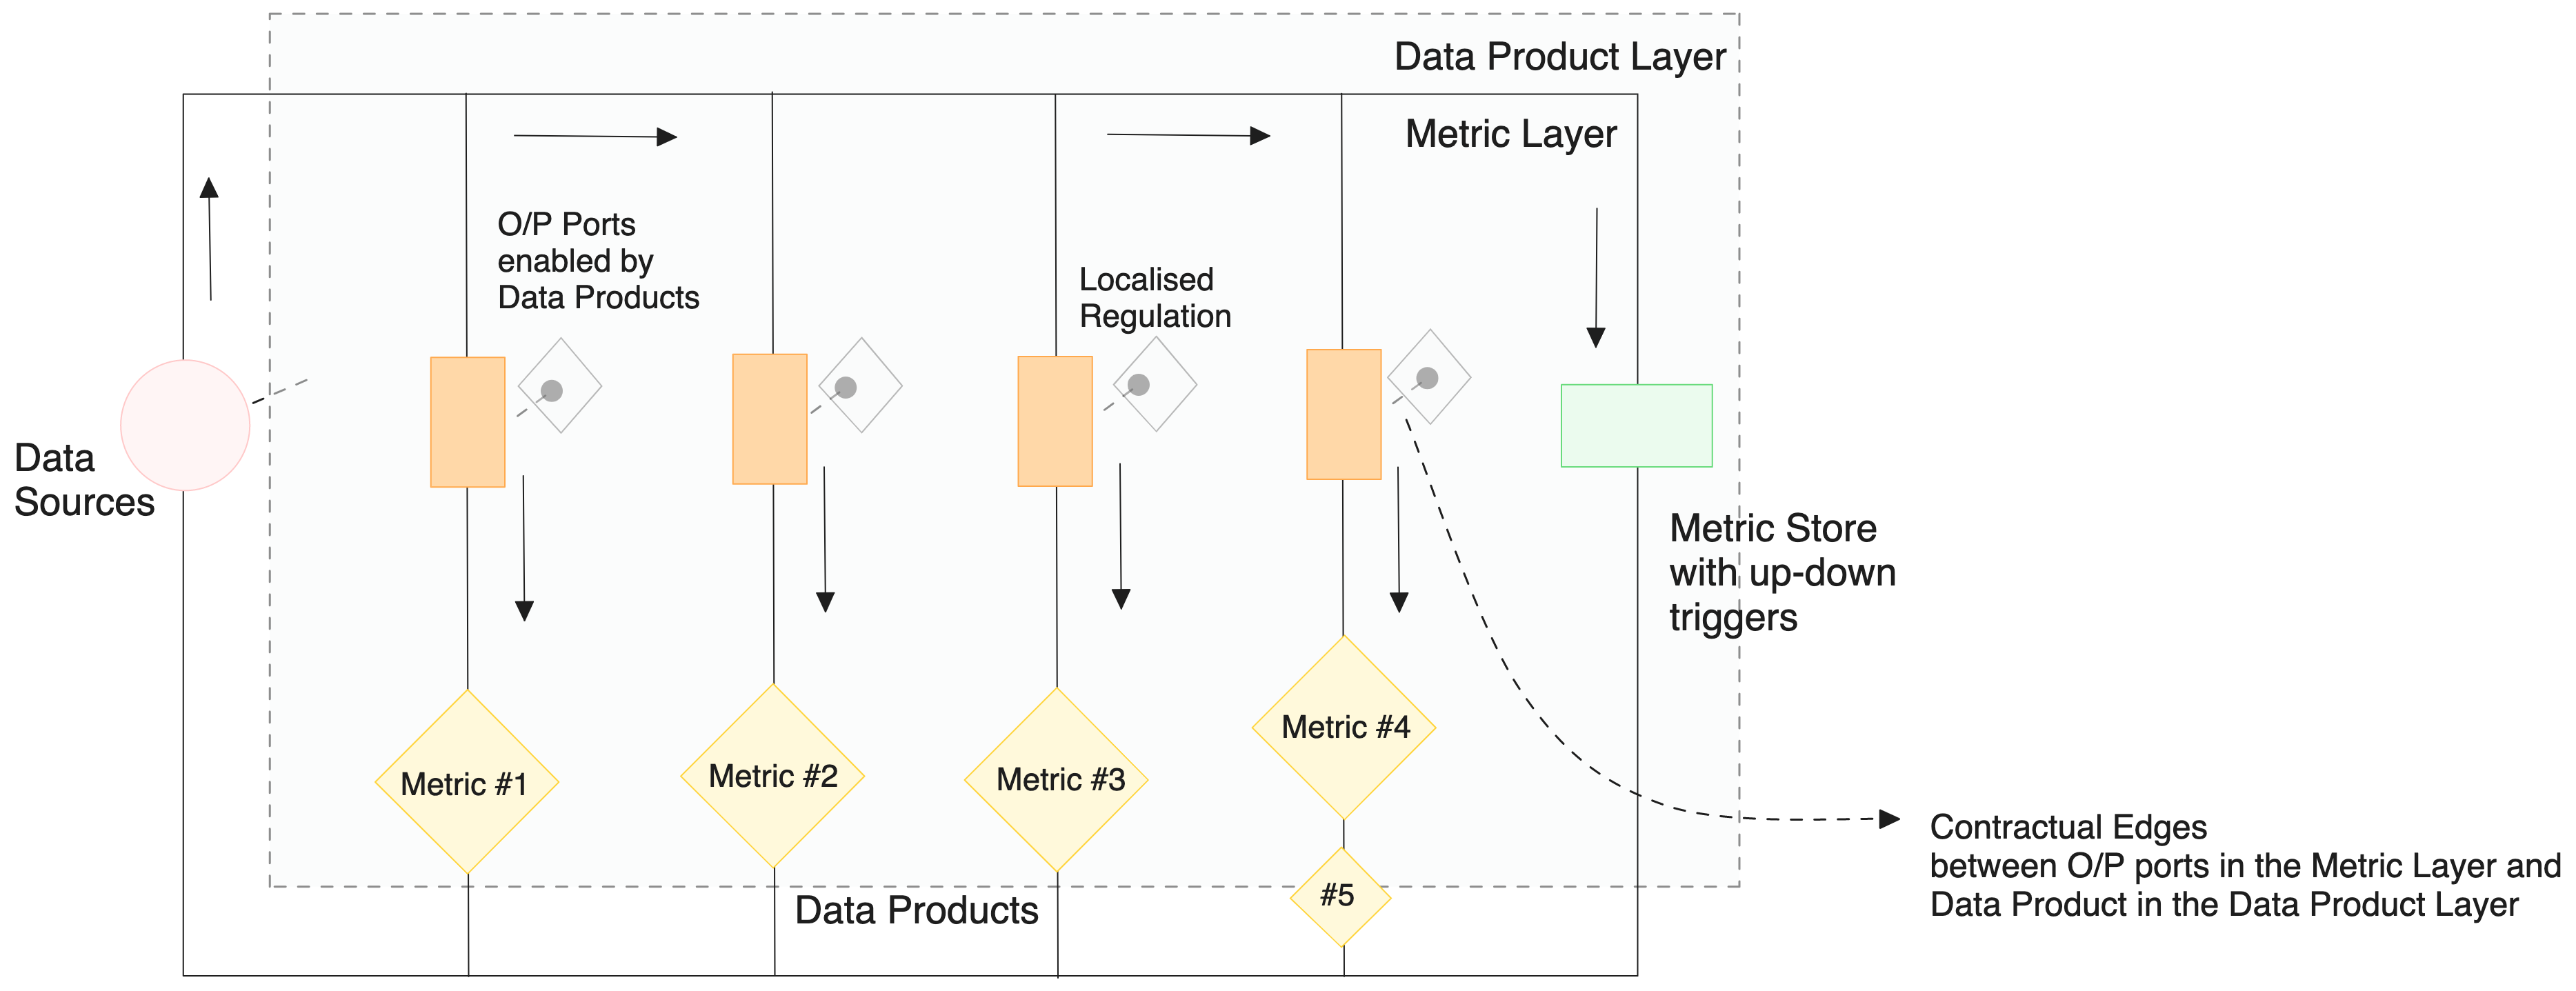
As a virtue of parallel circuits/pipelines, discrepancies in one shouldn't trigger fatalities in another unless they are directly dependent, e.g., metric #4 & #5 (series). Optimised metric life also implies the ability to consistently capture metric values and recover failed captures with minimal time to recovery. The data product layer behind the metric model becomes the enabler.
The metric’s health is also optimised through targeted RCA. When one metric goes off, you know exactly which loop to target. Think of a fuse distribution board, which is basically a great experience for true product experience.
Regulation prevents overwhelm, friction, and debt in processes and pipelines. Data could easily become chaotic and unmanageable without regulated resistance. While in prevalent systems and processes there are uncontrollable resistances, data products bring in the ability to regulate the right form of resistance. For example, say, SLOs in the form of quality checks or access and masking policies.
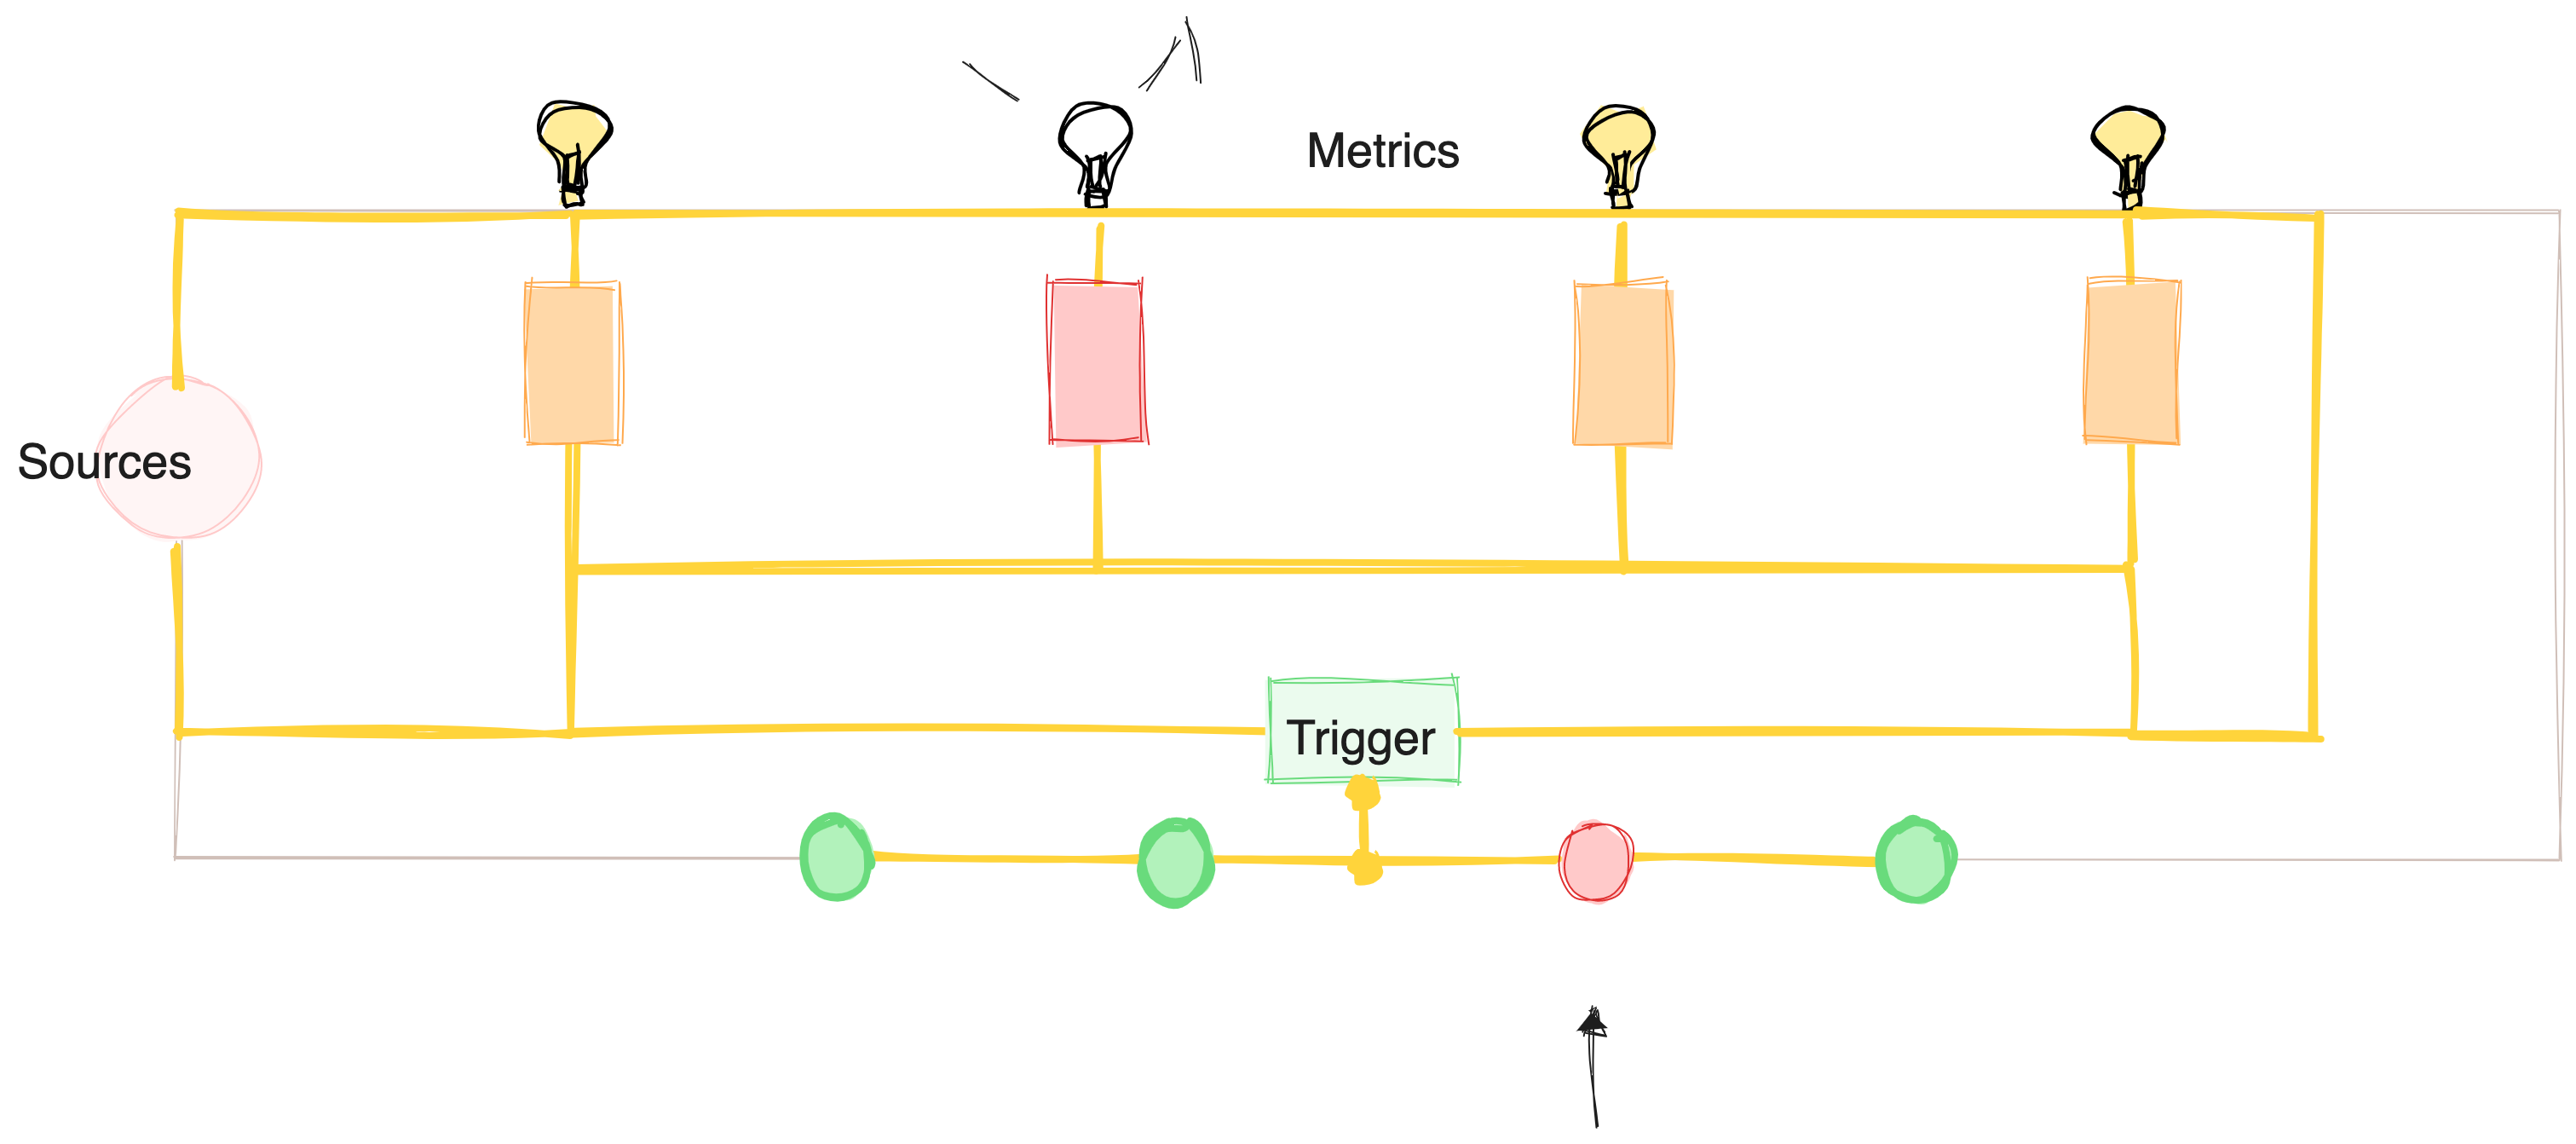
This is quite an interesting segment, as this makes one of the touch points between data products and the metrics. Specific output ports from a mesh of data products stream into the pipelines behind every metric in the metric model. Each output port is preceded by a contract that ensures the quality and governance as desired by the metric drivers.
There are two ways to establish these connections:
Maintains consistency in metrics by triggering recovery or boosting pipelines on flickering metric values (analogy of A.C.- bi-directional flow). This acts like a direct feedback loop between data and business.
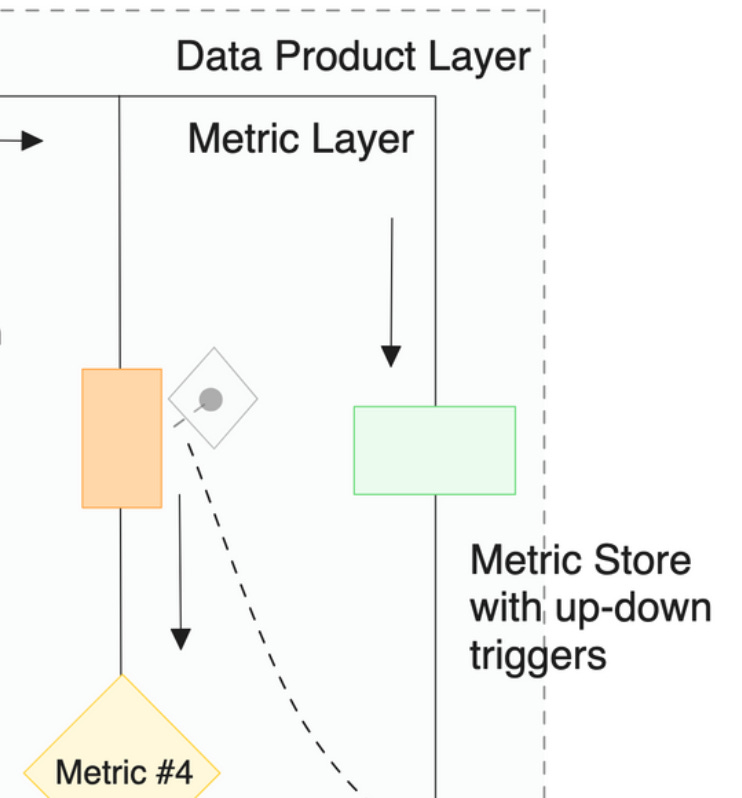
The metric store is the second touch point between data products and the metrics model, making this one of the primary components. Without a feedback loop that couples data initiatives with business goals, we would be pushed down to the same unresolved challenges where data efforts are disorganised and not even vaguely tied to the actual business impact. There needs to be a continuous feedback loop between outcome and activity. The metric store is that bridge, consistently passing metrics and triggers from business to data counterparts, allowing the data product management team to prioritise their efforts (refer to BCG matrix).
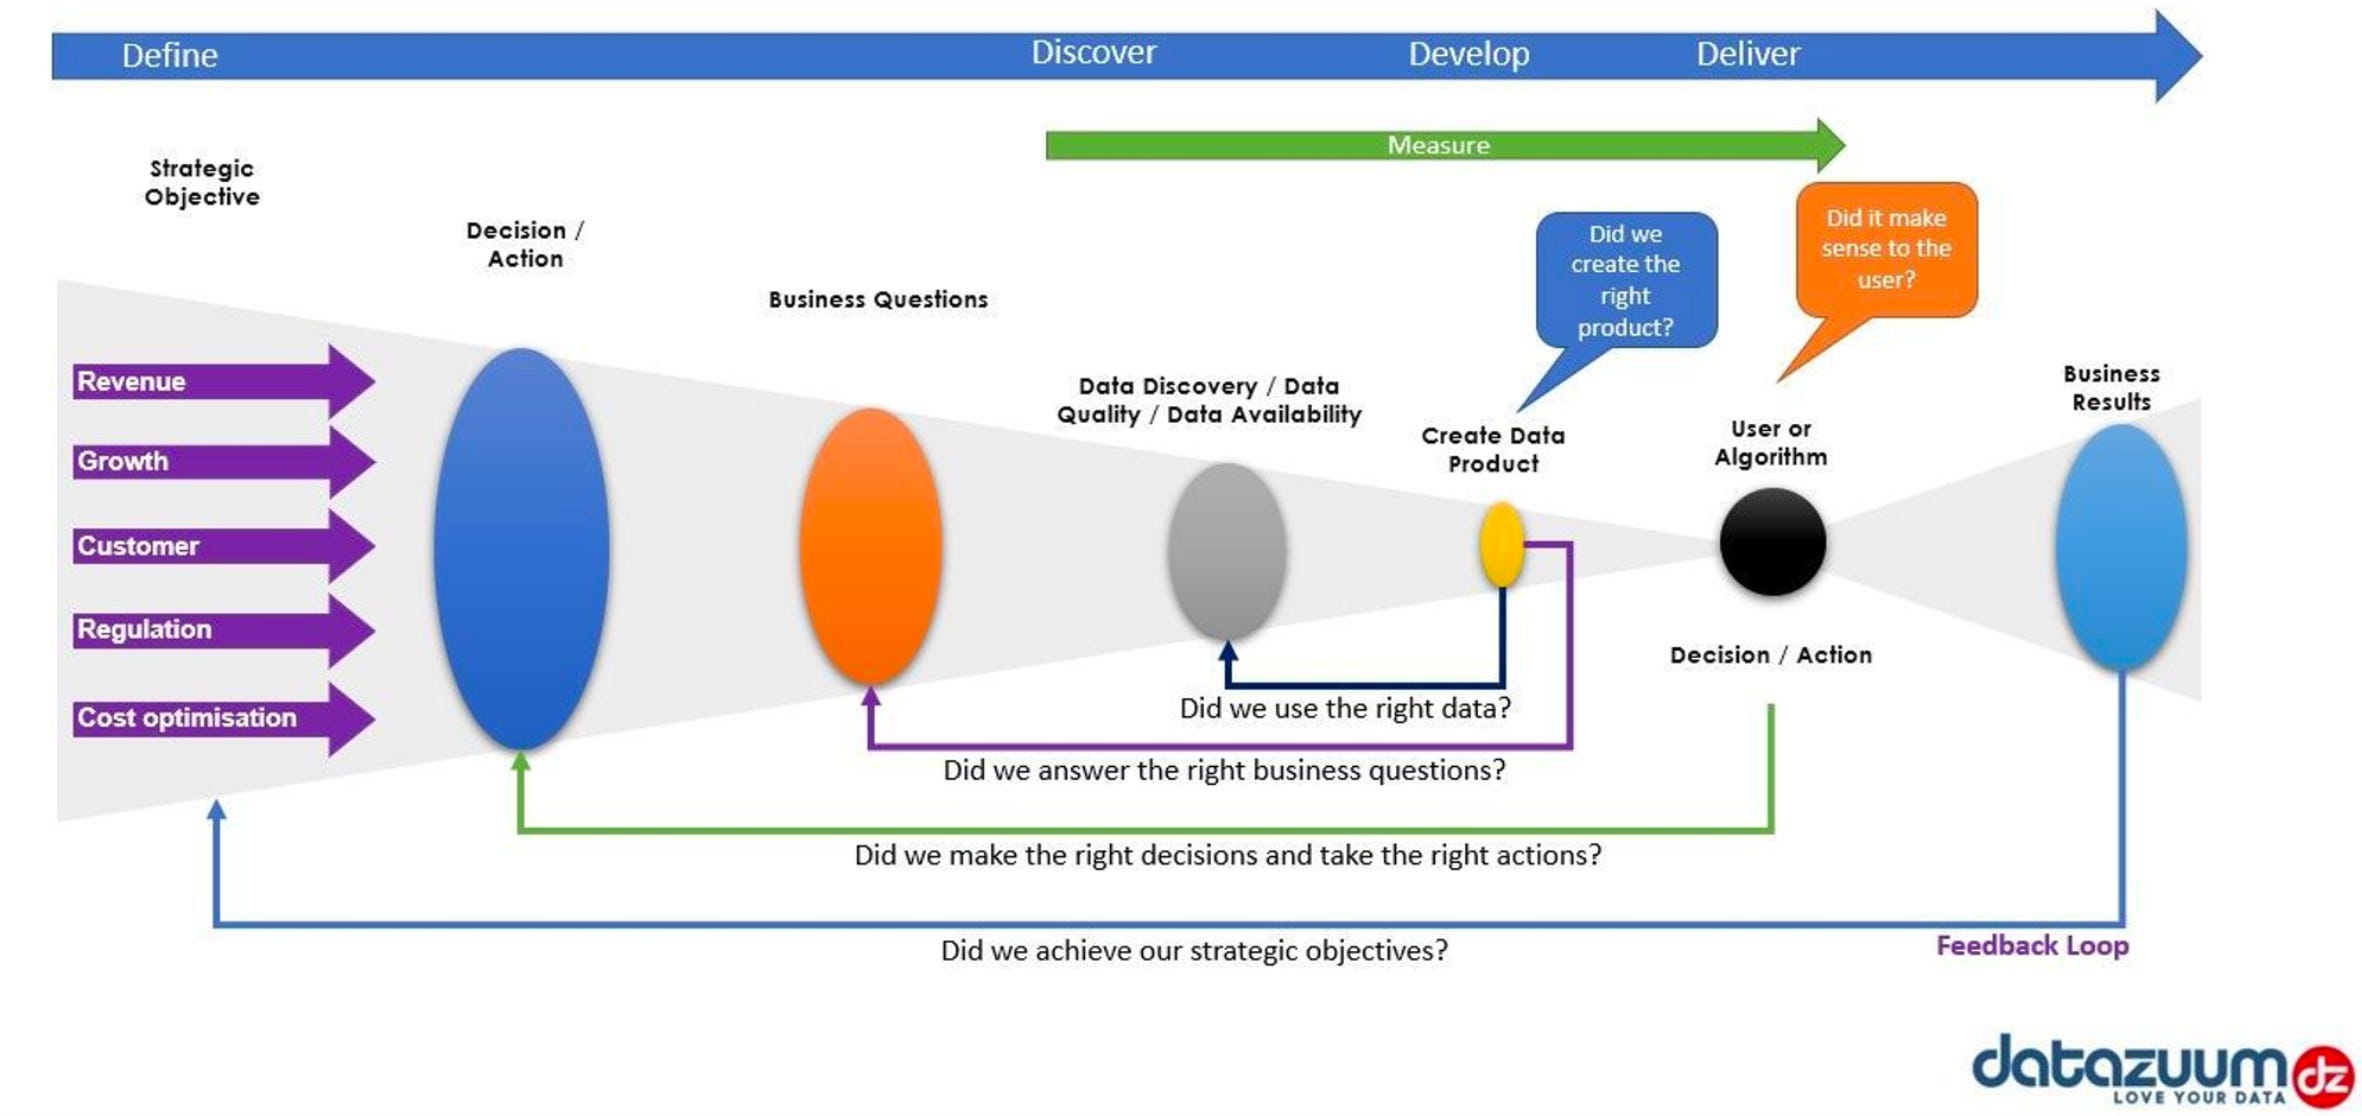
We’ve spoken several times about Samir Sharma’s data strategy with feedback loops as one of its major backbones. Will go out on a limb and say, this approach has disrupted the way we think about data in very implementable terms. Tying back metrics to data initiatives isn’t rocket science, and we could have concrete ways to establish the links.
Any new data product circuit or third-party tool can be added as loops or sub-loops after due diligence and strategy and would immediately inherit all the properties of the parallel model without any complex integration overhead.
During the course of last year, we came across some amazing data strategies and approaches, some of which we have highlighted here. We are glad to open up our approach and encourage discussions and enhancements around it. Here’s a quick revisit of the strategy.
Your Copy of the Modern Data Survey Report
Better decisions start with shared insight.
Pass it along to your team →

.avif)


Animesh Kumar is the Co-Founder and Chief Technology Officer at The Modern Data Company, where he leads the design and development of DataOS, the company’s flagship data operating system. With over two decades in data engineering and platform development, he is also the founding curator of Modern Data 101, an independent community for data leaders and practitioners, and a contributor to the Data Developer Platform (DDP) specification, shaping how the industry approaches data products and platforms.

I am a passionate & pragmatic leader, architect & engineer. I use iterative architecture & lean methodologies to deliver software products with measurable value, aligned with goals & objectives, on time & with balanced technical debt.

Helping #TechBrands with #TechMarketing & #TechLeaders with #PersonalBranding | Worked with #Forbes' Cloud 100 & #CBInsights' AI 100 brands

Find more community resources

Find all things data products, be it strategy, implementation, or a directory of top data product experts & their insights to learn from.
Connect with the minds shaping the future of data. Modern Data 101 is your gateway to share ideas and build relationships that drive innovation.
Showcase your expertise and stand out in a community of like-minded professionals. Share your journey, insights, and solutions with peers and industry leaders.


