Access full report
Oops! Something went wrong while submitting the form.

🤍

Facilitated by The Modern Data Company in collaboration with the Modern Data 101 Community
Latest reads...
%20(1).png)
TABLE OF CONTENT


This is part of the Data Product Lifecycle Series. If you’re new here, feel free to refer to:
Stage 1: Designing Data Products
Stage 2: Developing Data Products
Stage 3: Deploying Data Products
➡️ Introduction: ‘Evolve’ at a Glance, Relevance
➡️ Fundamentals
—— Evolutionary Architecture
—— Fitness Functions
—— Fitness Parameters
—— Dynamic Changes
—— Feedback Loops
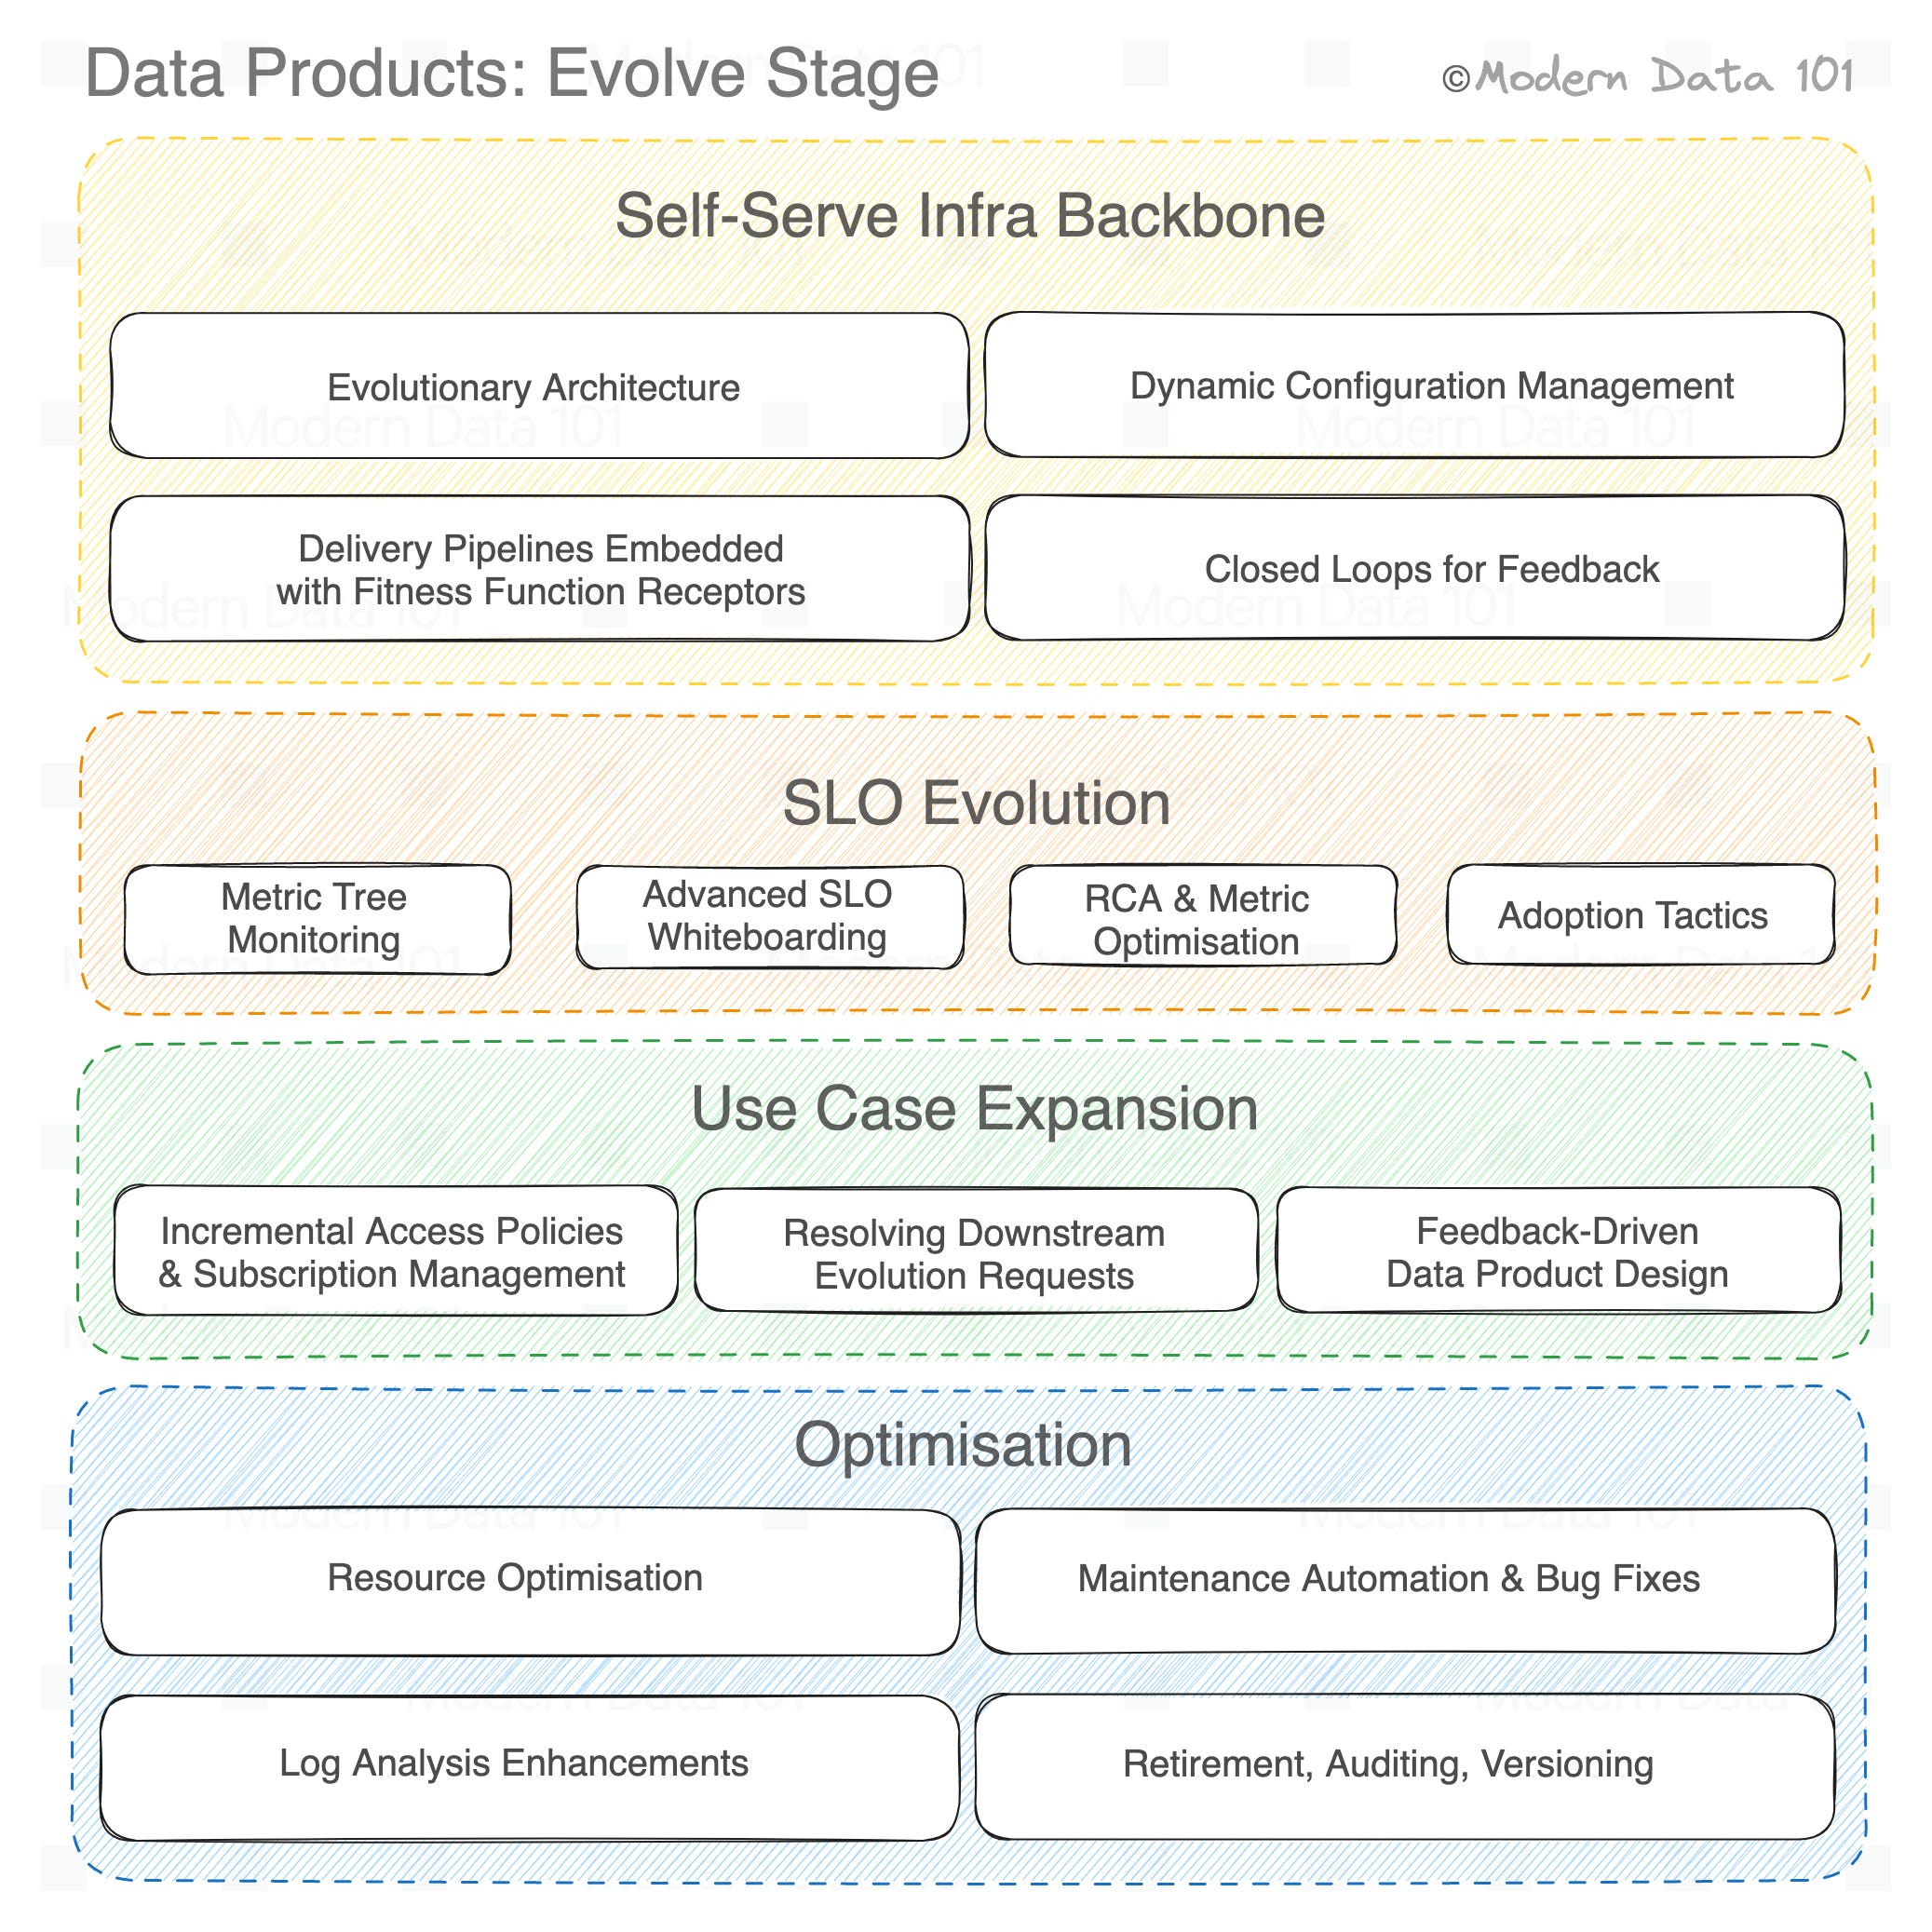
➡️ Evolving Data Products with Self-Serve Data Platforms
—— Metrics Monitoring, SLO Optimisation, Catalysts for Higher Adoption
—— Progressive Inclusion of Multiple Use Cases
—— Resource Optimisation
—— Maintenance Automation
—— RCA & Log Analysis Enhancements
—— Other Capabilities Critical to Evolve Stage
➡️ Fitness in the Context of Data Mesh
➡️ Final Note
. . .
The Data Product Lifecycle is not a linear but a continuous progression, and Stage 4, or the Evolution Phase, creates a concrete bridge to the initial Design Stage, contributing to the expansion and stabilisation of data products over time so domains can reap long-term value instead of kickstarting heavy and costly data initiatives every few months.
This would involve continuous monitoring across business metrics, policies, new and old architecture routes, semantic relationships or models, and more. This phase in the lifecycle also furnishes resource optimisation and maintenance toolkits for developers to react efficiently to monitoring incidents and enhance key fitness metrics such as time to recovery and uptime.
In essence, the Evolve Stage makes life easy for the two edges and the centre of the boat:
In terms of actual value, the Evolve Stage is essential to guarantee and enhance the following in data products:
➡️ High-quality and trustworthy data
➡️ Ease of access and operationalisation
➡️ Ease of interoperability or adaptability
➡️ Optimal performance and effort distribution
➡️ Ease of modification or flexibility
➡️ Ease of analysis and expansion
➡️ Continued data product relevance or retirement
While every stage in the data product lifecycle is intrinsically aligned to all the above objectives, it is in the evolve stage where you can actually measure and take real actions to optimise the above. Design, Build, and Deploy are all focused on creating the required Data Product, and evolution over iterations ensures that what has been created doesn’t become cancerous as is so commonly seen in the data domain.
The importance of this stage can be more cleanly visualised through proven models for electricity. Data is not so different if you think about it. If the Design, Build, and Deploy stages are akin to regulated/necessary resistance in series, Evolve acts as a capacitor in a parallel circuit.
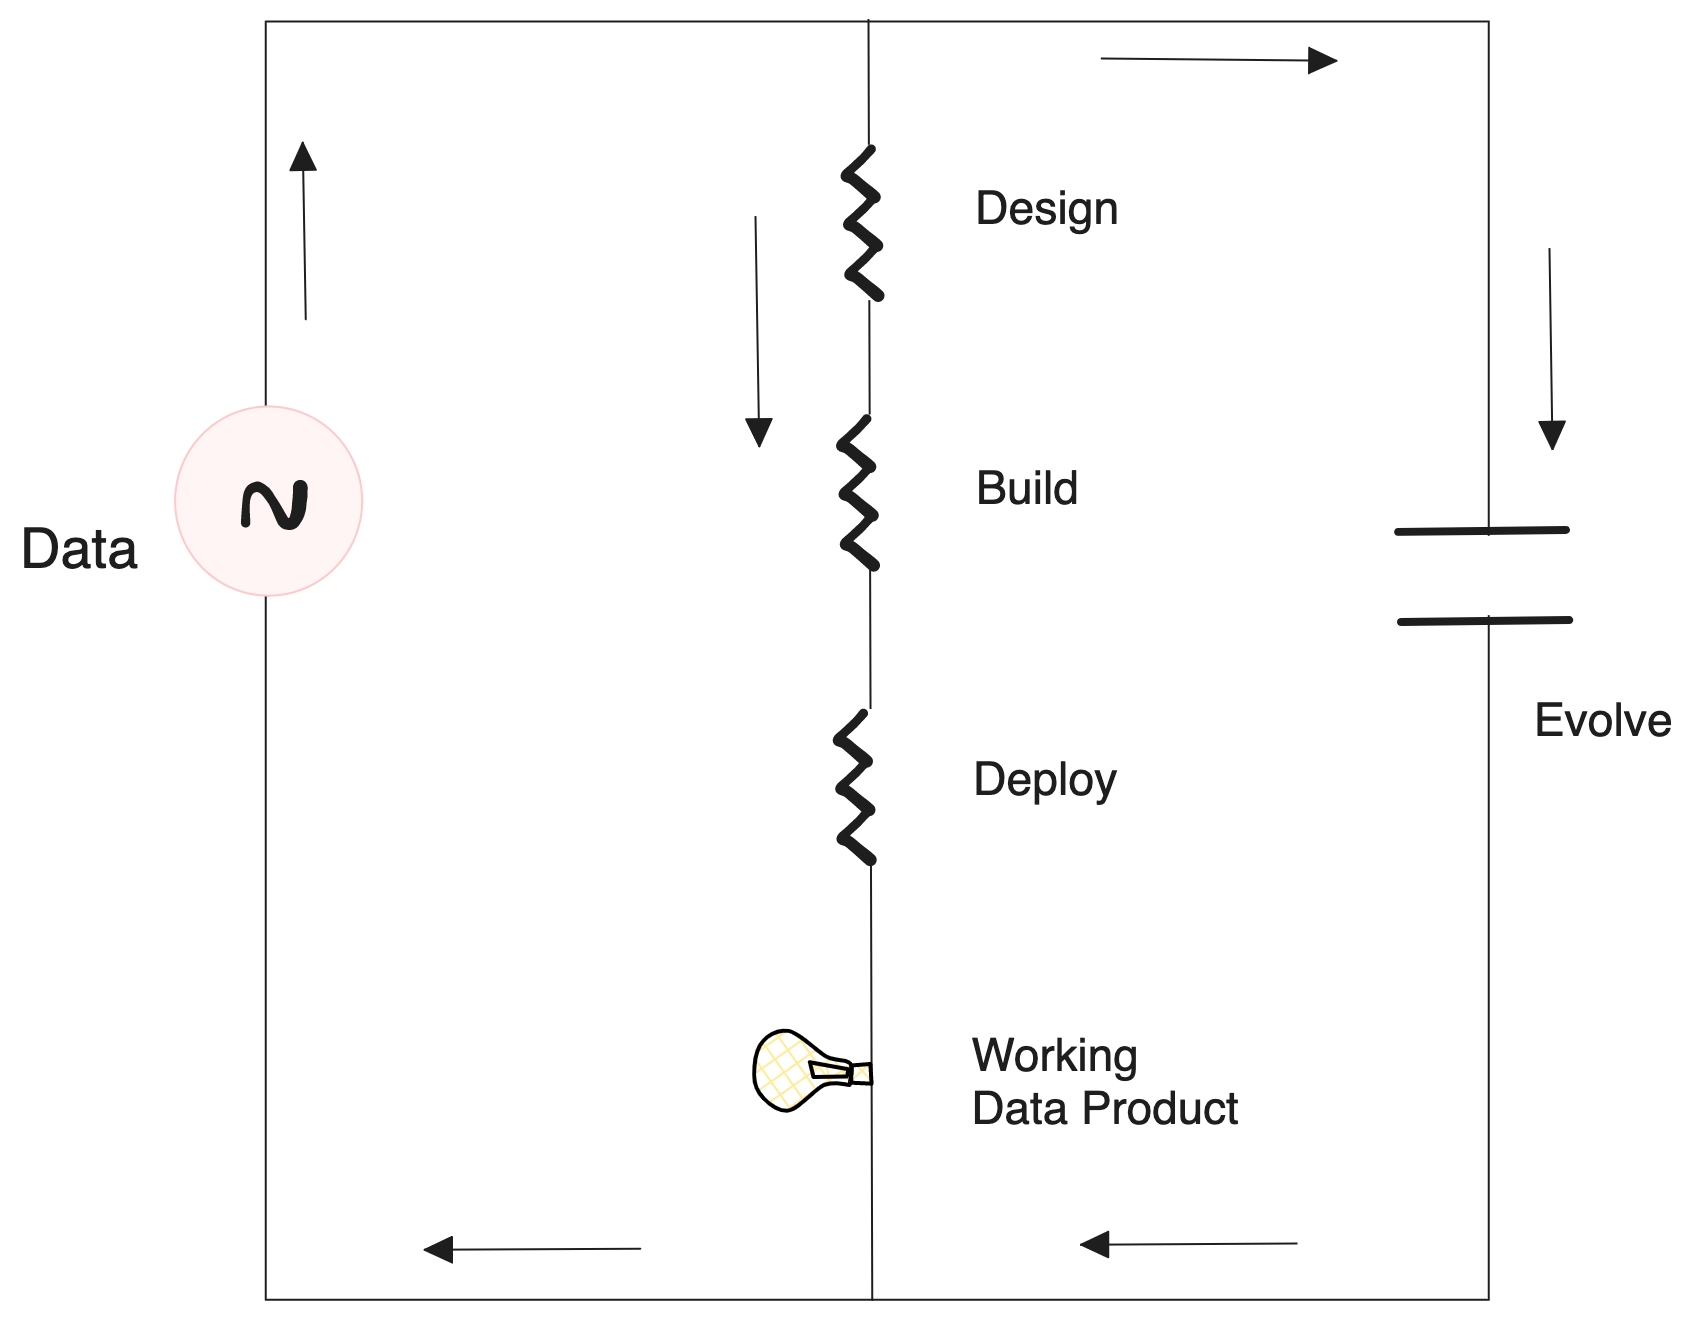
While the first three stages are enough to get the data product going, the Evolve phase, with its iterative nature, ensures the data product is running in optimal condition without disruptions or negative triggers, just like a capacitor that ensures stable voltage and maintains consistency in the circuit.
Importantly, another point that this inspired illustration brings out is how once Evolution is kicked off, it runs in parallel to other stages as a continuous process across all following cycles. While other stages run progressively in each cycle.
The groundwork for data product evolution, or the Evolve Stage, starts right at the beginning or during the Design Stage. Even before you start building or deploying your data products, you know the metrics across business, quality, and operational dimensions. This is done during the metric tree development and metric prioritisation in the design stage. The evolve stage completes the feedback loop.
Having a sense of key metrics and objectives across different functions also helps resolve conflicts early on without disrupting ongoing builds and deployments and restarting from scratch.
Before diving head-first into the evolve stage, we need some context around some fundamental concepts to truly grasp the power of the evolve stage.
As we always say, Data Products act as a cushion to disruptive technologies and innovations. This is because of its concrete and fundamental nature - the architectural quantum that empowers higher-order design patterns such as meshes, fabrics, and more. Change is the only constant, especially when it comes to data and the frameworks that enable it.
Evolutionary architectures are designed as a product that consumes change and responds with adaptive value.
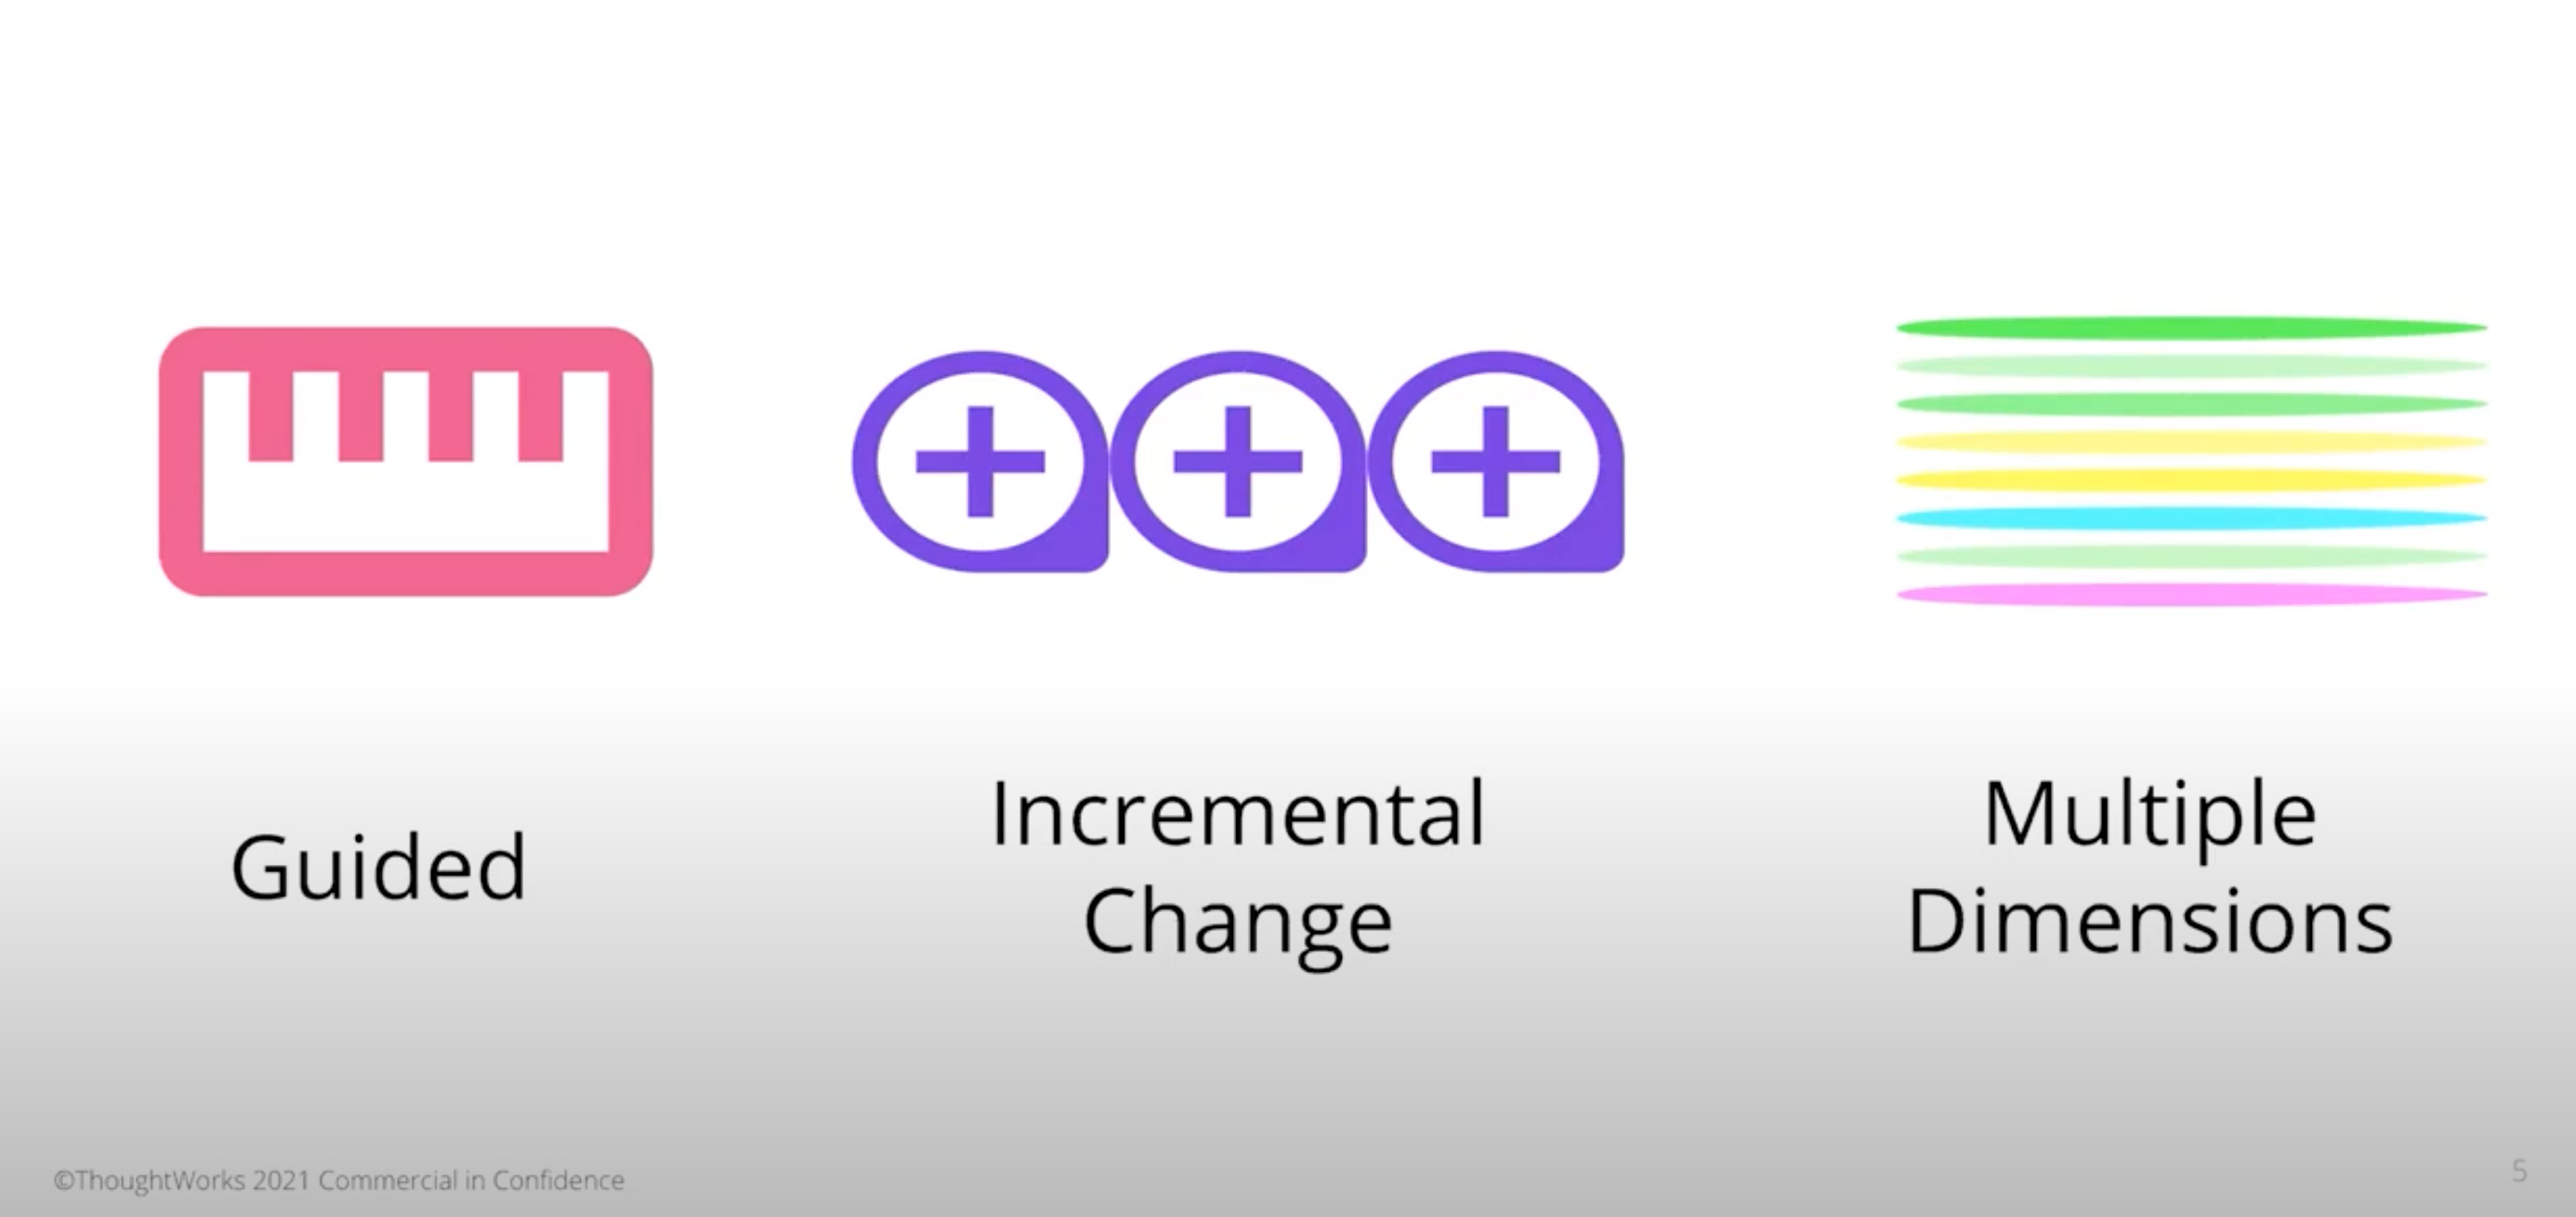
Therefore, when it comes to implementing or building data products, evolutionary architectures are the desired choice. Evolutionary architecture aims to introduce changes incrementally across multiple dimensions of the data infrastructure without impacting key ongoing operations (4D models inclusive of time instead of fixed 2D models). It impacts both development and operation cycles, enabling more efficient systems without the heavy cost of migration.
Fitness functions are a way to keep your processes running in an optimal state. They act as guides to navigate the transitory nature of evolutionary architectures.
Fitness functions describe how close an architecture is to achieving an architectural aim. Regardless of the application architecture (monolith, microservices, or other), fitness function-driven development can introduce continuous feedback for architectural conformance and inform the development process as it happens, rather than after the fact.
~ThoughtWorks Archives
A delivery pipeline listens for disruptions and guides processes as per the objectives of the fitness functions. Every data product bundle that is created must pass the fitness functions embedded in the delivery pipelines to qualify as a data product.
Some of the parameters, in the context of data products, that are assessed and verified by delivery pipelines include:
Data: Quality, availability, manageability, debuggability, auditability, resiliency, security
Code: Modifiability, debuggability, adaptability, manageability, security
Infrastructure: Stability, resiliency, availability, scalability, auditability, security
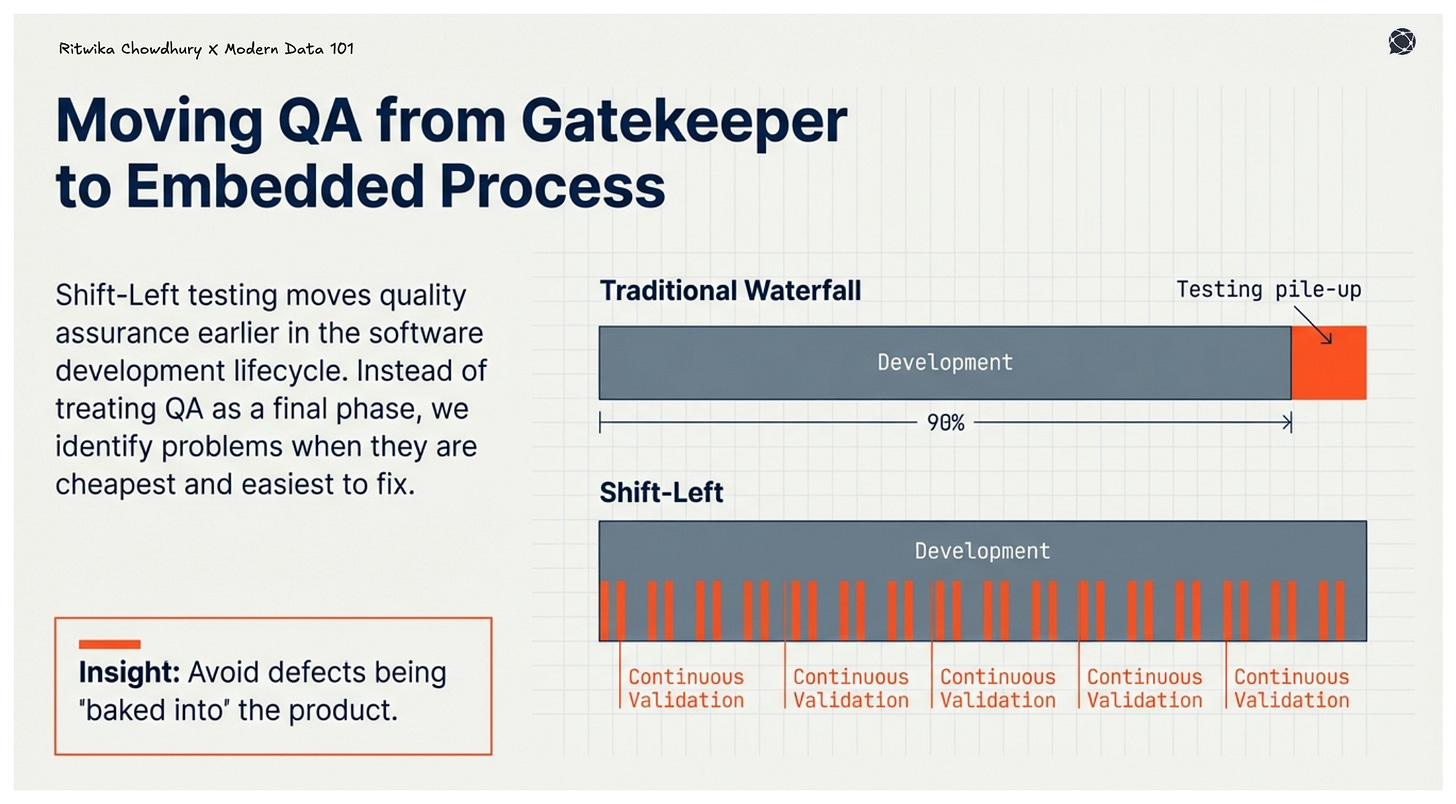
Examining these themes often uncovers potential conflicts or architectural tradeoffs. For example, goals for agility and flexibility may conflict with goals for stability and resiliency.
Stability and agility are often diametrically opposed because of the way they are pursued. We attempt to achieve stability by establishing control over change and creating gatekeepers, while innovation and agility are enabled by reducing barriers to change in order to minimize the chance of failure.
~ Fitness Function-Driven Development
Knowing what’s wrong isn’t enough. You need actionable channels to propagate recovery operations. This is where dynamic configuration management facilitated by data developer platforms (DDP) has a significant role. DDPs enable evolutionary architectures by providing the foundation of consistent change management. It enables data developers to host guides in the form of fitness functions and dynamically manage configuration drifts to optimise mean time to recovery (MTTR) and uptime.
The Data Strategy Measurement and Success Framework proposed by Samir Sharma talks about ensuring that your data initiatives are coupled with the goal. This is essential to not drift away from actual value; it is easy to get lost in tangled pipelines and layers of effort when it comes to heavy data projects. To ensure clear alignment with business value, you enable the following:
🔄 Continuous feedback loops between outcome and activity
🧮 Metrics and KPIs to optimise and test the relevance of operations
In the context of Data Products, the Evolve Stage helps you to create the bridge and close the feedback loops with each of the previous stages involving the underlying infrastructure and code. These feedback loops power the transitions of evolution in the architecture.
Fitness functions are the core of the Evolve Stage, which guarantees a healthy data ecosystem. Let’s revisit some of the parameters that ensure the optimal state of data products as well as the data product ecosystem:
➡️ High-quality and trustworthy data
➡️ Ease of access and operationalisation
➡️ Ease of interoperability or adaptability
➡️ Optimal performance and effort distribution
➡️ Ease of modification or flexibility
➡️ Ease of analysis and expansion
➡️ Continued data product relevance or retirement
Evolve Stage in data developer platforms furnishes the following attributes to establish the above.
A comprehensive metrics monitoring system, enabling developers to track and analyse KPIs such as data processing times, error rates, and usage statistics. Data developer platforms deploy observability across the end-to-end data ecosystem, including internal and external:
1. Source systems
2. Transformation workflows
3. Infrastructure resources and routes
4. Data and metadata
5. Input and output ports
Metrics are a fundamental token in the data product strategy. A metric tree forms the heart of data products, and consistent observation keeps the blood flowing. Data Products are built with the objective to usefully adapt to the dynamic state of data systems and to optimise the experience of end-users along with moving use cases.

The metric tree embraces all touchpoints across layers of data, metadata, code, and infrastructure. Any data platform enabling you to build data products is consequently bound to observe parameters across these metrics. This could be a good way for you as well to narrow down the right data developer platform to enable you.
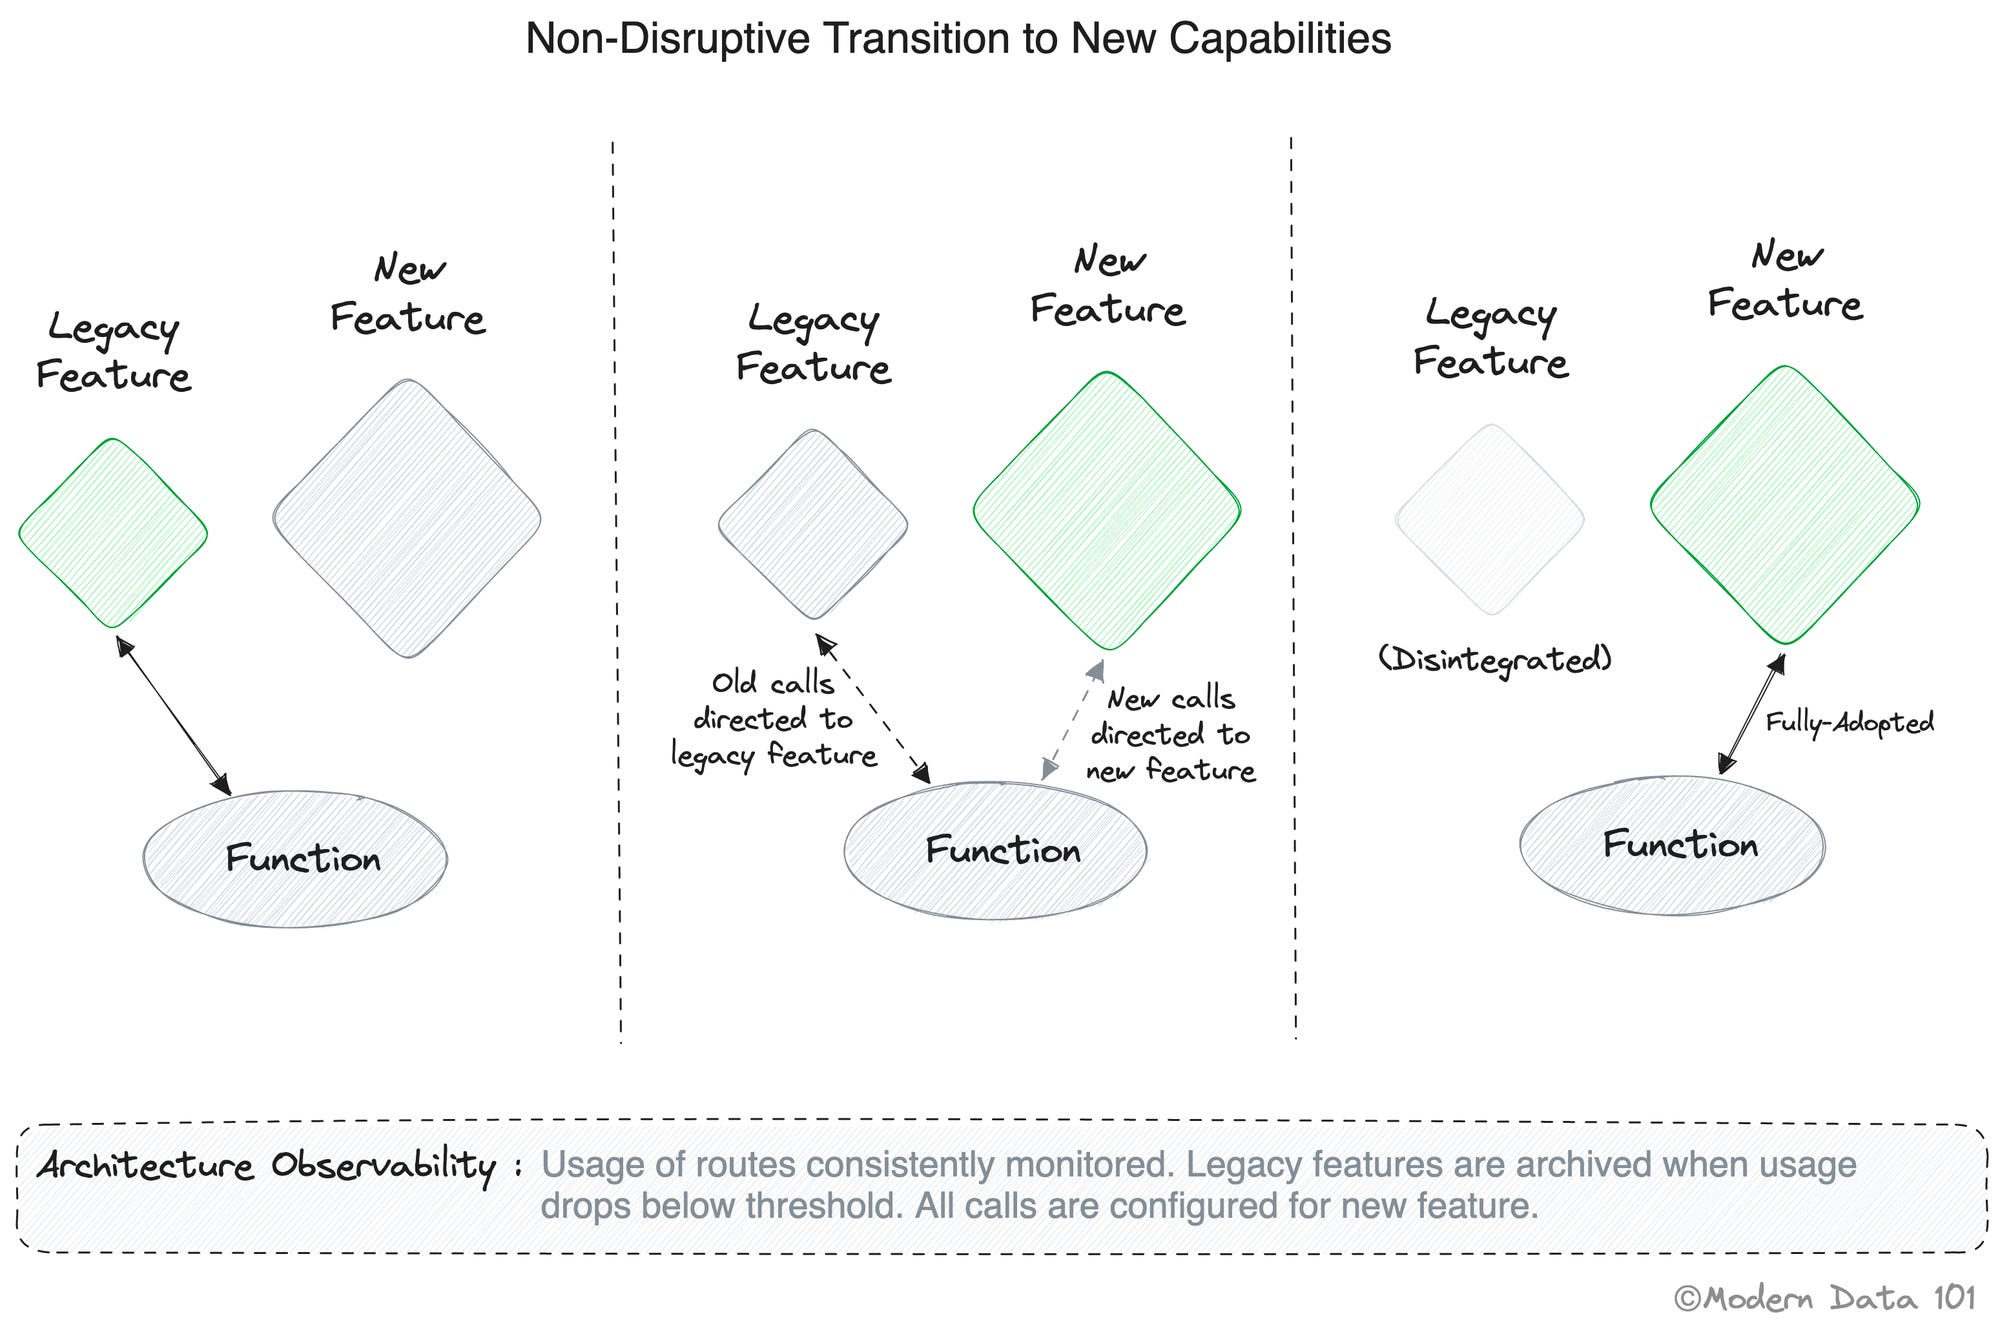
A centralised metric store maintains consistency in metrics by triggering recovery/boosting workflows on noting values flickering beyond the decided threshold. This acts like a direct feedback loop between data and business.
Important note: The reason for not isolating the metric store within domains is to enable global visibility and usage for metrics in use cases that span multiple domains, which is most use cases. Whereas data products are bounded within domains to establish quality and governance for data served by the domains for usually collaborative use cases.
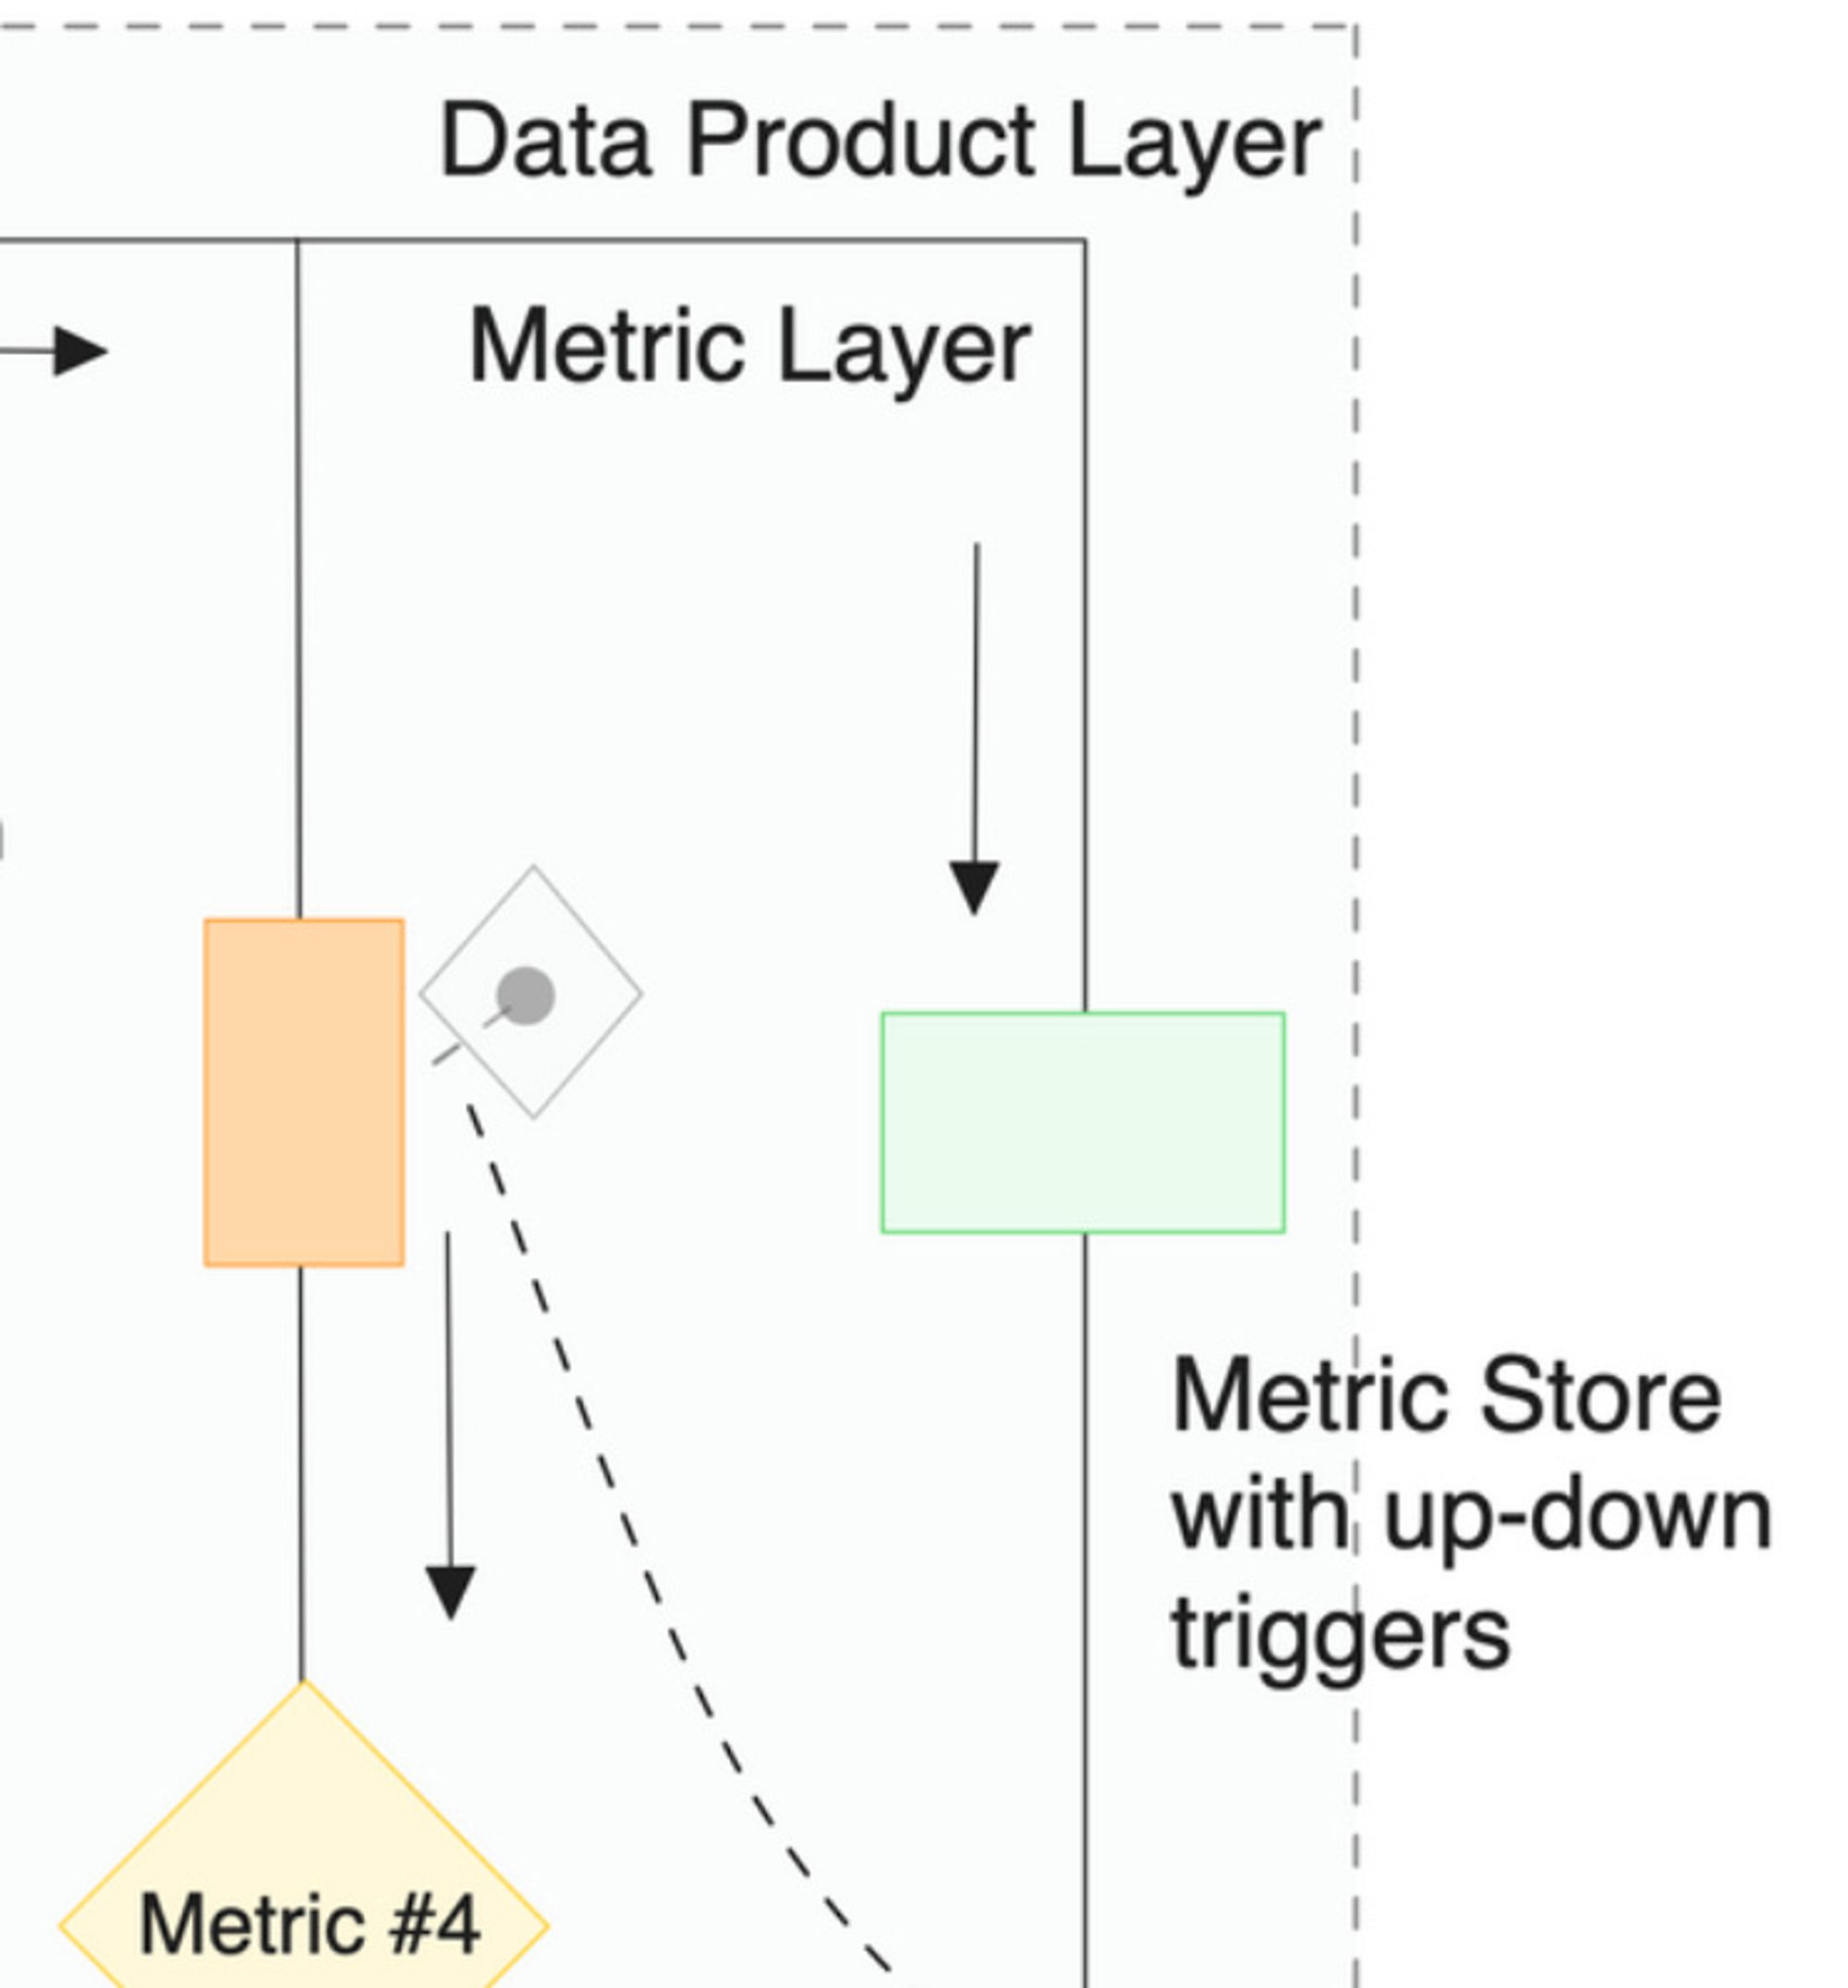
The metric store is the second touch point between data products and the metrics model, making this one of the primary components. Without a feedback loop that couples data initiatives with business goals, we would be pushed down to the same unresolved challenges where data efforts are disorganised and not even vaguely tied to the actual business impact.
There needs to be a continuous feedback loop between outcome and activity. The metric store is that bridge, consistently passing metric and trigger information from business to data counterparts, allowing the data product management team to prioritise their efforts (refer to BCG matrix).
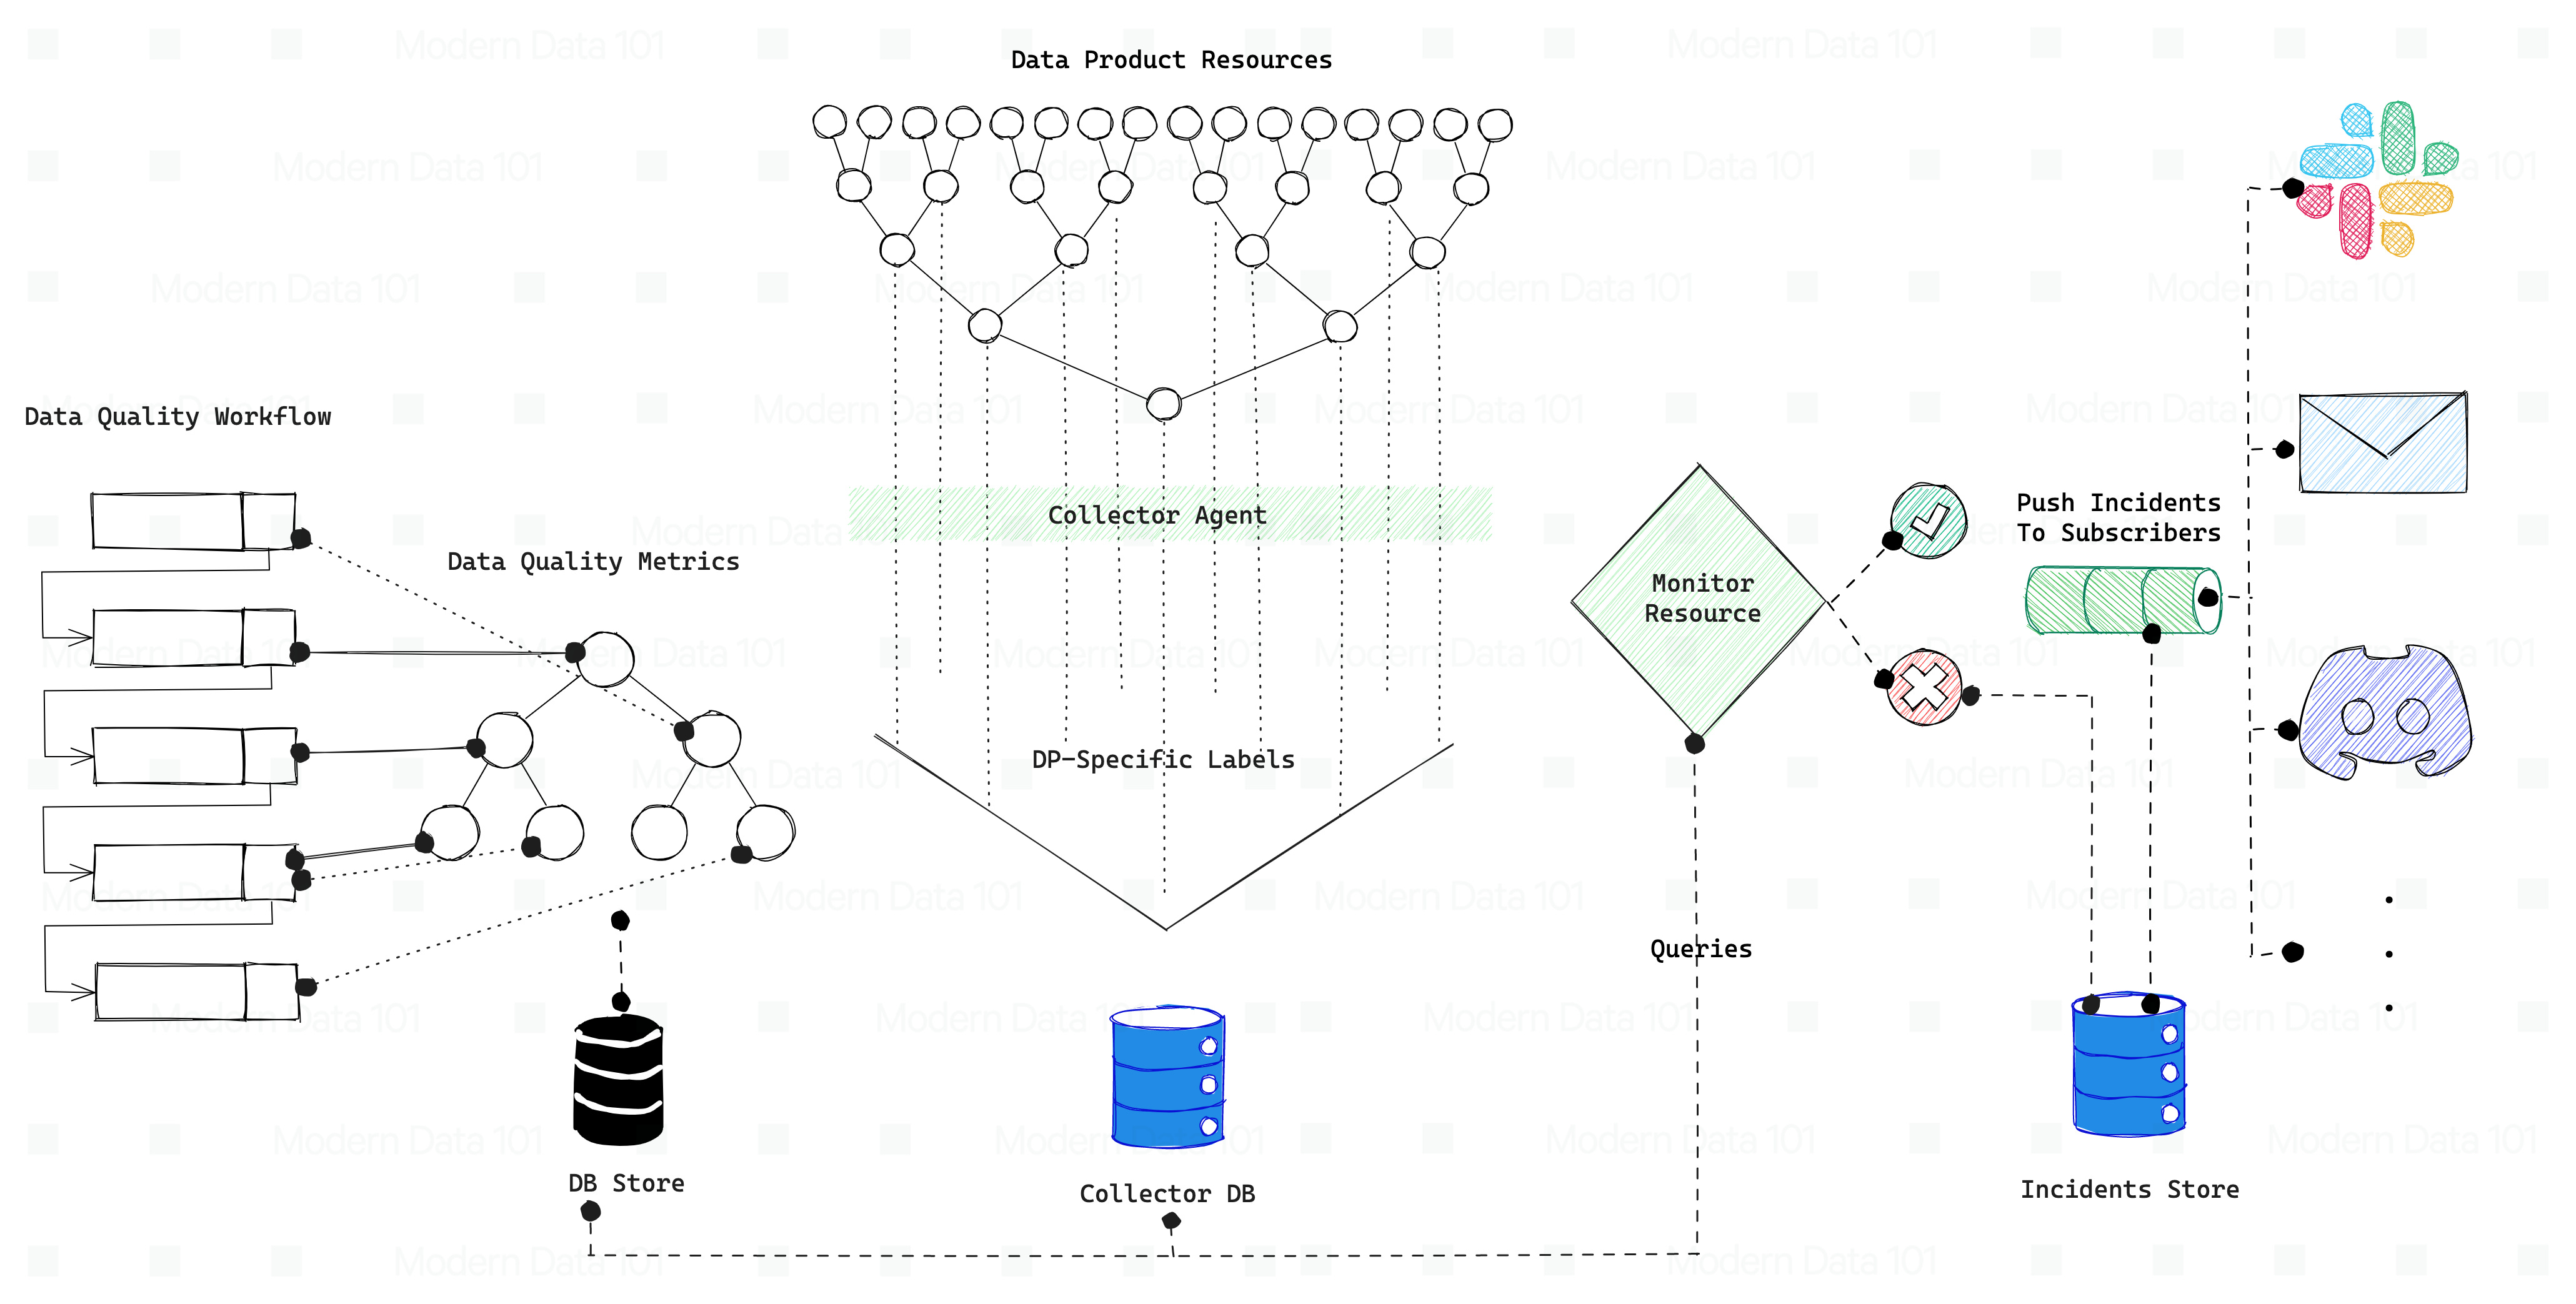
Below is a recommended set of resources necessary to enable monitoring of Data Products. The Data Dev needs to create the following resources and package them in the Data Product bundle:
1. Data Quality Workflow: This workflow generates Data Quality metrics and stores them in a DB table.
2. Metric Collector agent: This will scrape the metrics from the resources, assign DP-specific labels to these metrics and send them to the primary collector to store them in the collecter DB.
3. Metric (Optional): Users can employ this resource to create and store user-defined custom metrics.
4. Monitor: This resource queries Metric stores depending on the source to evaluate conditions. If the violation conditions are met, it writes Incidents to the Incident Store.
5. Watcher (Optional): Users who wish to receive alerts about incidents (SLO breaches) on external communication apps like Slack, Email, Teams, and others must create a Watcher resource. This resource monitors incidents and delivers alerts to its subscribed users.
Metrics are essentially SLOs, and the metric tree could be seen as an SLO model. The Evolve Stage not only actively observes this model for ups and downs but also helps all contributors optimise the data product.
For example, in the first cycle, based on the data product requirements, a certain set of SLOs and metrics are finalised in the design stage. The initial stage also looks after SLO conflicts or mergers. For instance, a campaign team might need fresh data every hour, while analysts may need fresh data at the end of the day for reporting. There is potential to converge the SLO to one hour. Analysts certainly wouldn’t complain if the data is updated more frequently in this case.
Consider the above across multiple threads in the data product. Finalising these aspects at the design stage streamlines efforts and inherently optimises the SLOs. Phase 4, or the Evolve Stage, comes into the picture to evolve SLOs and improve Data Product adoption.
By this stage, unlike the design stage, you have a clear picture of a working Data Product. Consequently, a much better idea of the feasibility, hidden requirements, and true potential. This knowledge helps us grow more developed branches in the metric tree or SLO model.
Advanced SLOs can better validate data product quality and encourage wider use throughout the organization. For example, let’s imagine the data in our Customer 360 data product is not complete. Perhaps an internal exercise revealed the channel and region where the customer buys the product is important for the marketing team’s digital advertising decisions while the customer service team cares deeply that every customer has a profile in the system.
We could use field health monitors on relevant fields within the data product, such as region and channel, to surface the number of anomalies over a certain time period on the attributes the marketing team needs to segment users. Deploying field health monitors has the added benefit of profiling the data, which can provide additional context that helps encourage adoption for those not as familiar with the data or the data product.
~ Building An “Amazon.com” For Your Data Products
A Data Product is like a hub - it serves multiple use cases with similar data requirements in a particular domain. For example, a company might have an AI product that is modelled on payment data to predict when the clients of the customers are expected to make batch order payments. This particular solution works with various payment tables, streaming data, customer data, etc.
Interestingly, a data product designed for this domain will serve multiple use cases that work with these data assets the data product manages. For instance, customer and order data are also used by another solution for, say, deductions.
Once the data product is deployed, the iterations enable data stewards to introduce enhanced or new policies that make way for new use cases as and when they arrive. Even one use case might have different sub-cases. For example, the payment date prediction use case for different customers.
Solutions for different customers might need different access policies, and cyclic iterations make way for systematically introducing new governance protocols in a standardised way.
Let’s assume our downstream users have been using a said data product and, based on their experience, feel the need to have a new feature. They can request the same through a seamless UI layer, such as the data catalog, accessible and operable by anyone, irrespective of how savvy they are with low-level tech.
The catalog is the primary touchpoint for downstream consumers to discover and access data products and their respective assets and resources. It’s a simple way to expose all existing data products in the org along with enough information for consumers to decide its value and potential use.
These downstream consumers can simply use a commenting or chatting interface of the Metis catalog to voice their requests, which would be converted into a new ticket for the said data product. These requests could be around addition of new use cases, renewed access policies, new quality expectations, or even hard schema changes.
Every time there is an iteration on a Data Product and new changes surface, downstream users are also notified of the upcoming changes and the reflected changes through the same interface, in our case, the Metis catalog UI. In essence, it serves as a standard interface for capturing iteration requirements as well as surfacing the outcomes of the iterations.
The evolve stage involves a toolkit for optimising resource allocation and usage to ensure optimal performance and cost-effectiveness. It gives complete visibility into all the resources and stacks used for creating a data product that powers certain use cases.
It’s important to get a concrete view of both impact and resource usage to strategize optimisation. Is a high usage pattern justified for a specific use case? If not, how can I optimise the resource allocation or de-provision resources? Is the infrastructure properly autoscaling the resources? If yes, are there any further customisations necessary?
Once a data product is deployed, usage metrics appear on the data product dashboard at both bundle and pod levels. Every pod is an individual resource or a set of resources fulfilling one objective. Users can evaluate the impact against usage to create a strategy for optimisation. The self-serve infrastructure already provides a default auto-scaling for resources, which can be hyper-optimised through the optimisation toolkit.
Just as an example of the thoroughness of such an optimisation toolkit, let’s take the compute resource. The resource optimisation toolkit furnishes all granular details around the metadata and runtime logs of the resource.
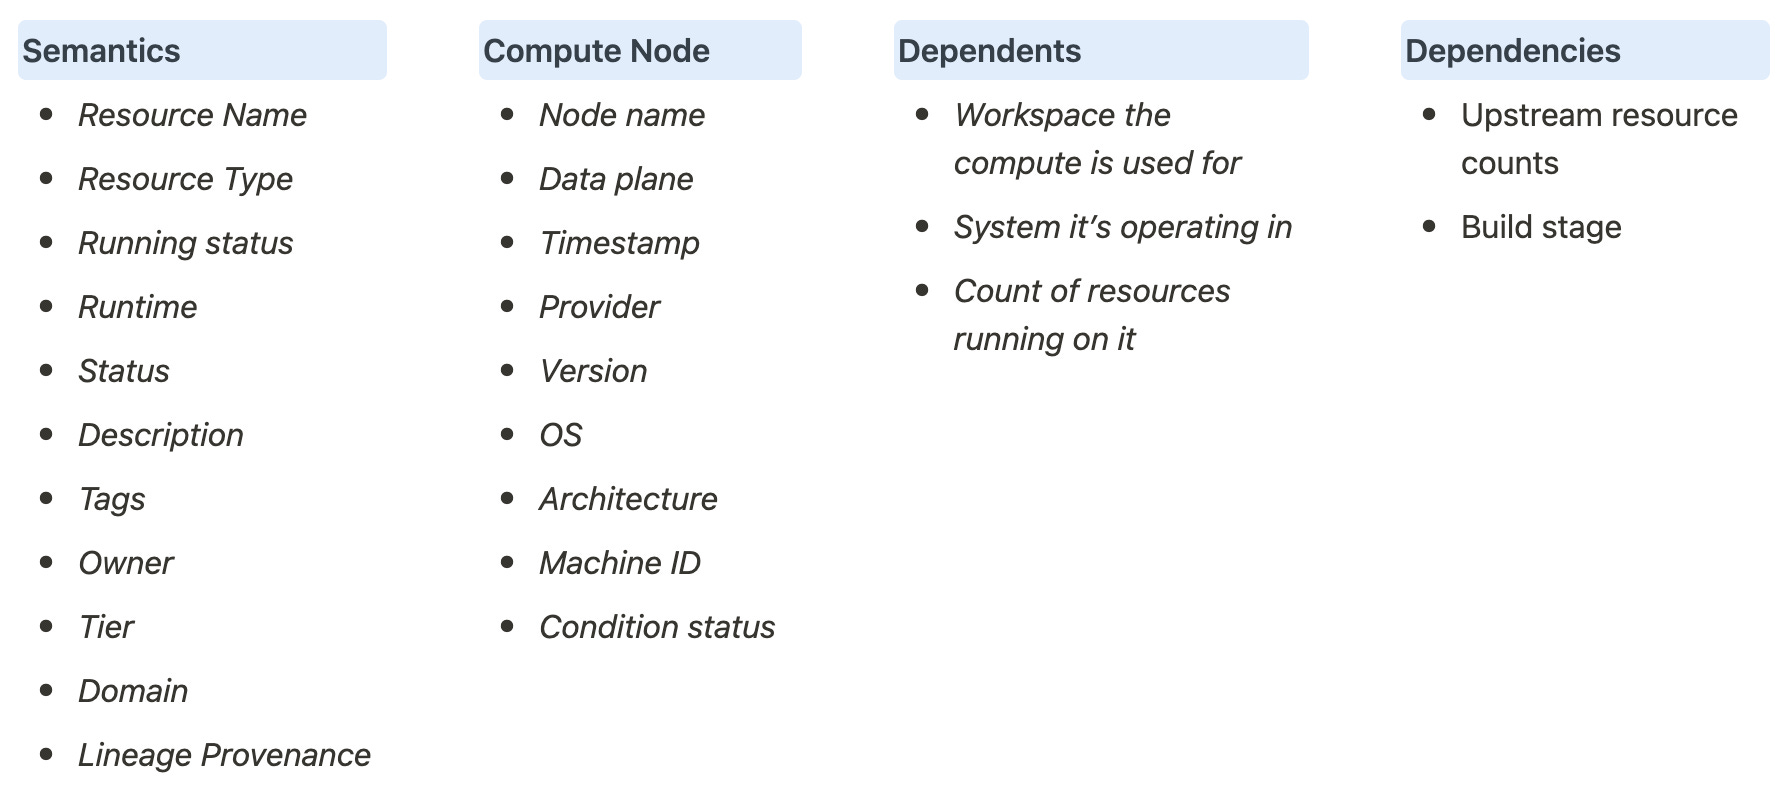
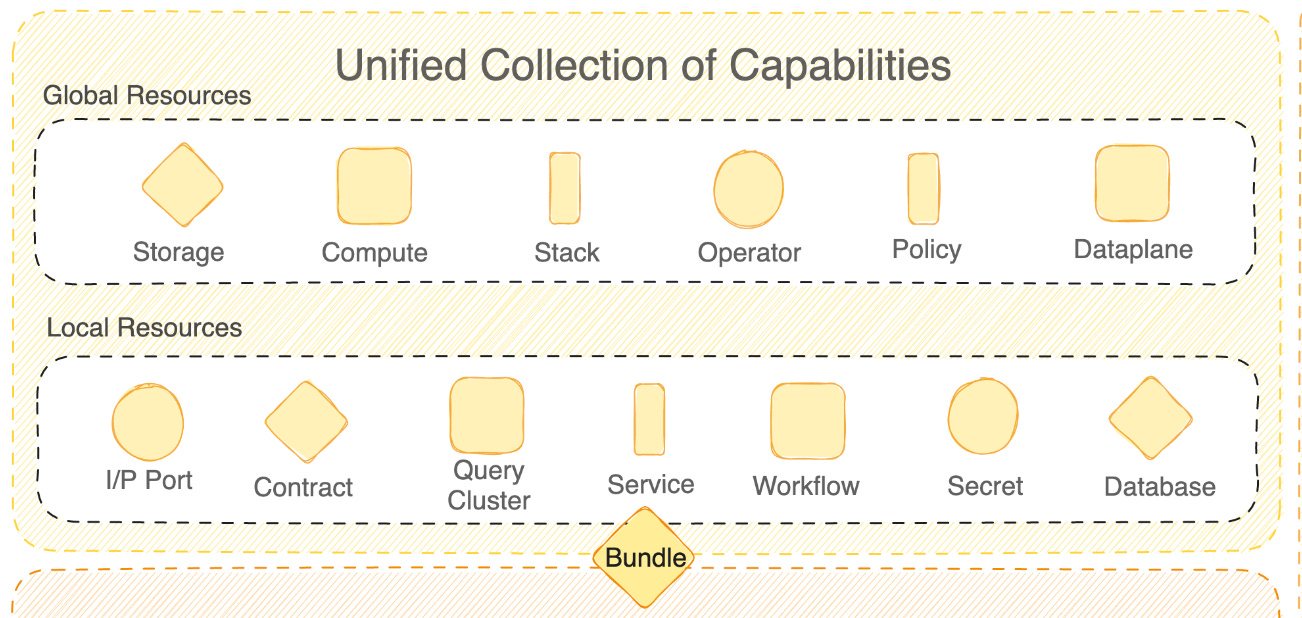
Details are surfaced as per the specifications of each resource type used in the data product. Here’s a mostly exhaustive list of resources that act as fundamental building blocks for data products: Compute, Cluster, Workflow, Service, Depot, Stack, Bundle, Operator, Dataset, Policy, Model, Contract, Worker, Secret, and more. All of them are made available by standard data developer platforms but need not be mandatorily used while creating data products.
Evolve Stage comes right after Build and Deploy in the context of Data Products. In essence, the product created must be maintained during this phase. Data developer platforms enable users to develop automated tools for routine maintenance tasks, including updates, patches, and stability checks.
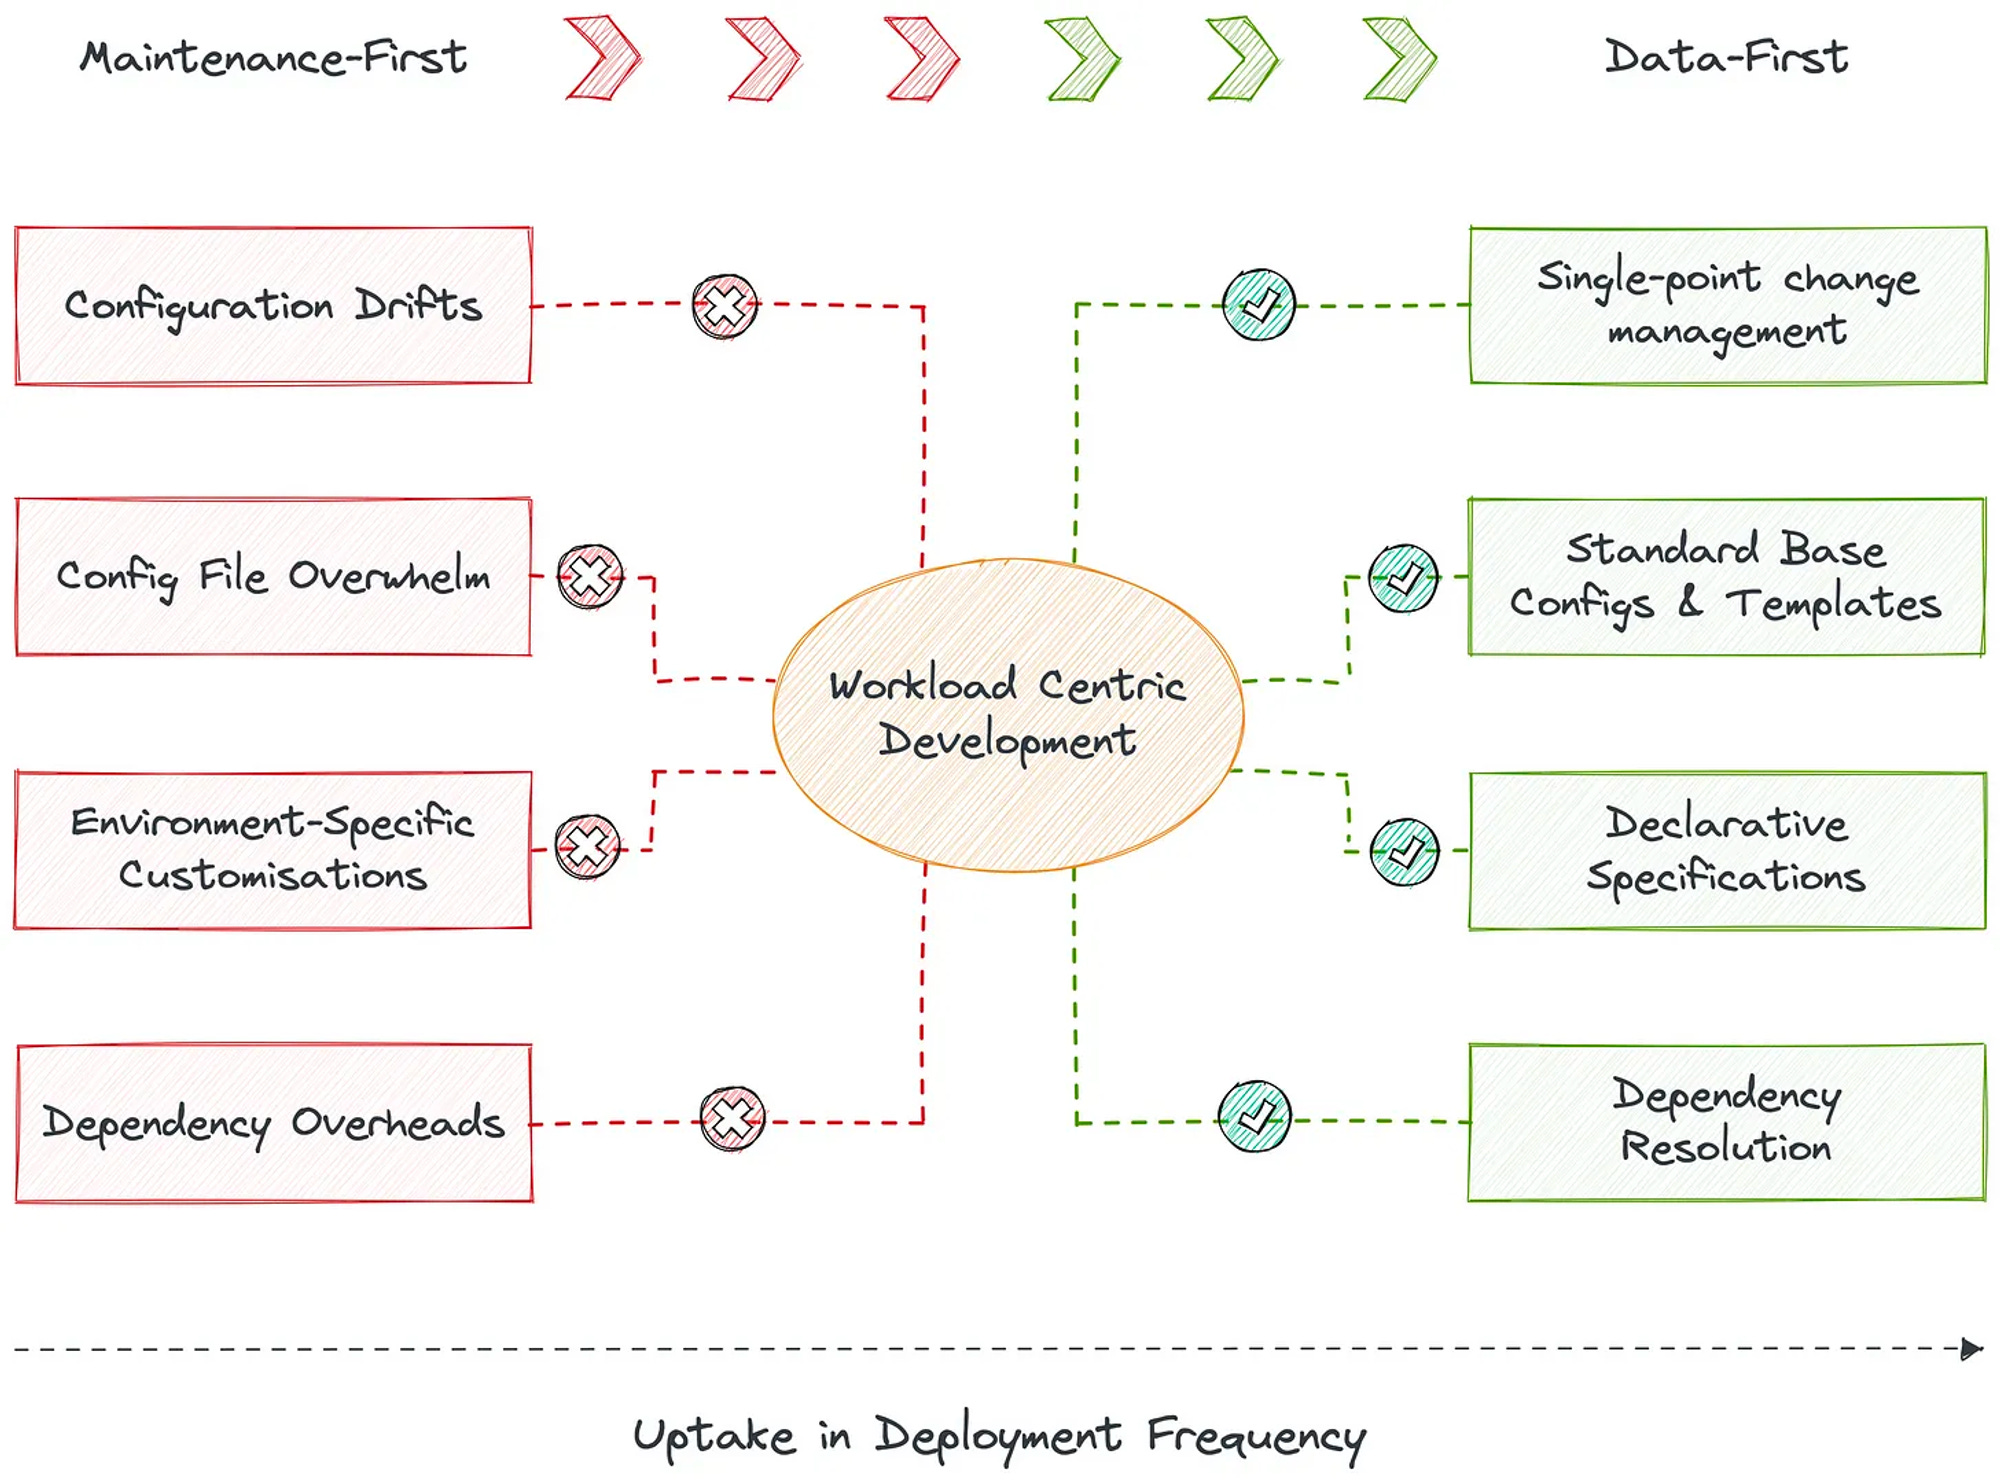
The concept of dynamic configuration management (DCM) is the heart of automated maintenance. DCM distils all points of change into a single point of management. How is this possible? Through a low-lying self-serve infrastructure platform that composes all moving parts with a unified architecture. Such an architecture identifies fundamental atomic building blocks (resources that we discussed above) that are non-negotiables in a data stack.
Storage, compute, cluster, policy, service, and workflow are some examples of these resources. With these components packaged through infrastructure as code, developers can easily implement workload-centric development where they declaratively specify config requirements and infrastructure provisions and deploy resources at respective environments. Whenever a point of change arises, the developer makes the required change in the declarative specification to mirror the change across all dependent environments.
In the context of Data Products, a Data Product Bundle becomes that specification file where data developers can come and contain configuration drifts without the cognitive load of reflecting changes across other files and code that make up the data product. Moreover, as a virtue of Data Products, all code is stationed in one place, in a single repo that tracks end-to-end lineage and version diffs.
After data products are deployed, and monitoring kicks off, you need the ability to deep-dive into incidents and analyse the root cause behind them. DDPs enable developers to enhance tools for Root Cause Analysis (RCA) and semantic log analysis, aiding in diagnosing and resolving issues efficiently.
An end-to-end observability system is the core enabler of advanced RCA across all four layers of data, metadata, code, and infrastructure. DDP inherently comes with an observability system where teams can:
Root cause analysis, in other words, is investigating which upstream changes could have resulted in a downstream issue. A thorough view of lineage with a careful selection of fitness functions and metrics at every touchpoint brings forth the points of disruption, enabling developers to minimise the mean time to recovery every time a ticket pops up.
After your data product is built and deployed, observability kicks in and starts projecting incidents, if any. You can find out the root cause behind every incident by falling back on the lineage. Every touchpoint of the data product across the segments of data & metadata, code, and infrastructure is embedded with metrics (as part of the metric tree) and suitable quality checks. When checking the lineage, all points of disruptions are therefore highlighted, so developers can narrow down on them instead of spending hours understanding a wide scope.
Retirement and Auditing Mechanisms
Implement procedures for data product retirement, compliance audits, and robust data governance.
Bug Fixes, Enhancements, and Version Control
Establish version control practices, issue tracking, and roll-back mechanisms for managing updates, bug fixes, and enhancements for your data products and data product resources.
Subscription Management System
Create a subscription management system to enable users to receive updates, notifications, and relevant information about subscribed data products.
All four principles of Data Mesh are overlapping in nature and, therefore, critical to consider even in the context of the data product lifecycle (given one of the principles is ‘Data as a Product’). How we design, build, and maintain data products directly impacts the fitness of the entire mesh, which is essentially a web of several data products.
Below is an overview or a few highlights of what makes a mesh fit. To ensure fitness across these parameters, different fitness functions are configured in the delivery pipelines.
For example, to maintain “native flexibility” for domains, a metric could be the number of native tools, processes, or platforms that can actively interact with the data product. Or, to measure how well the infrastructure is abstracting complexities, we could configure metrics such as deployment uptake and increase in usage by business counterparts.
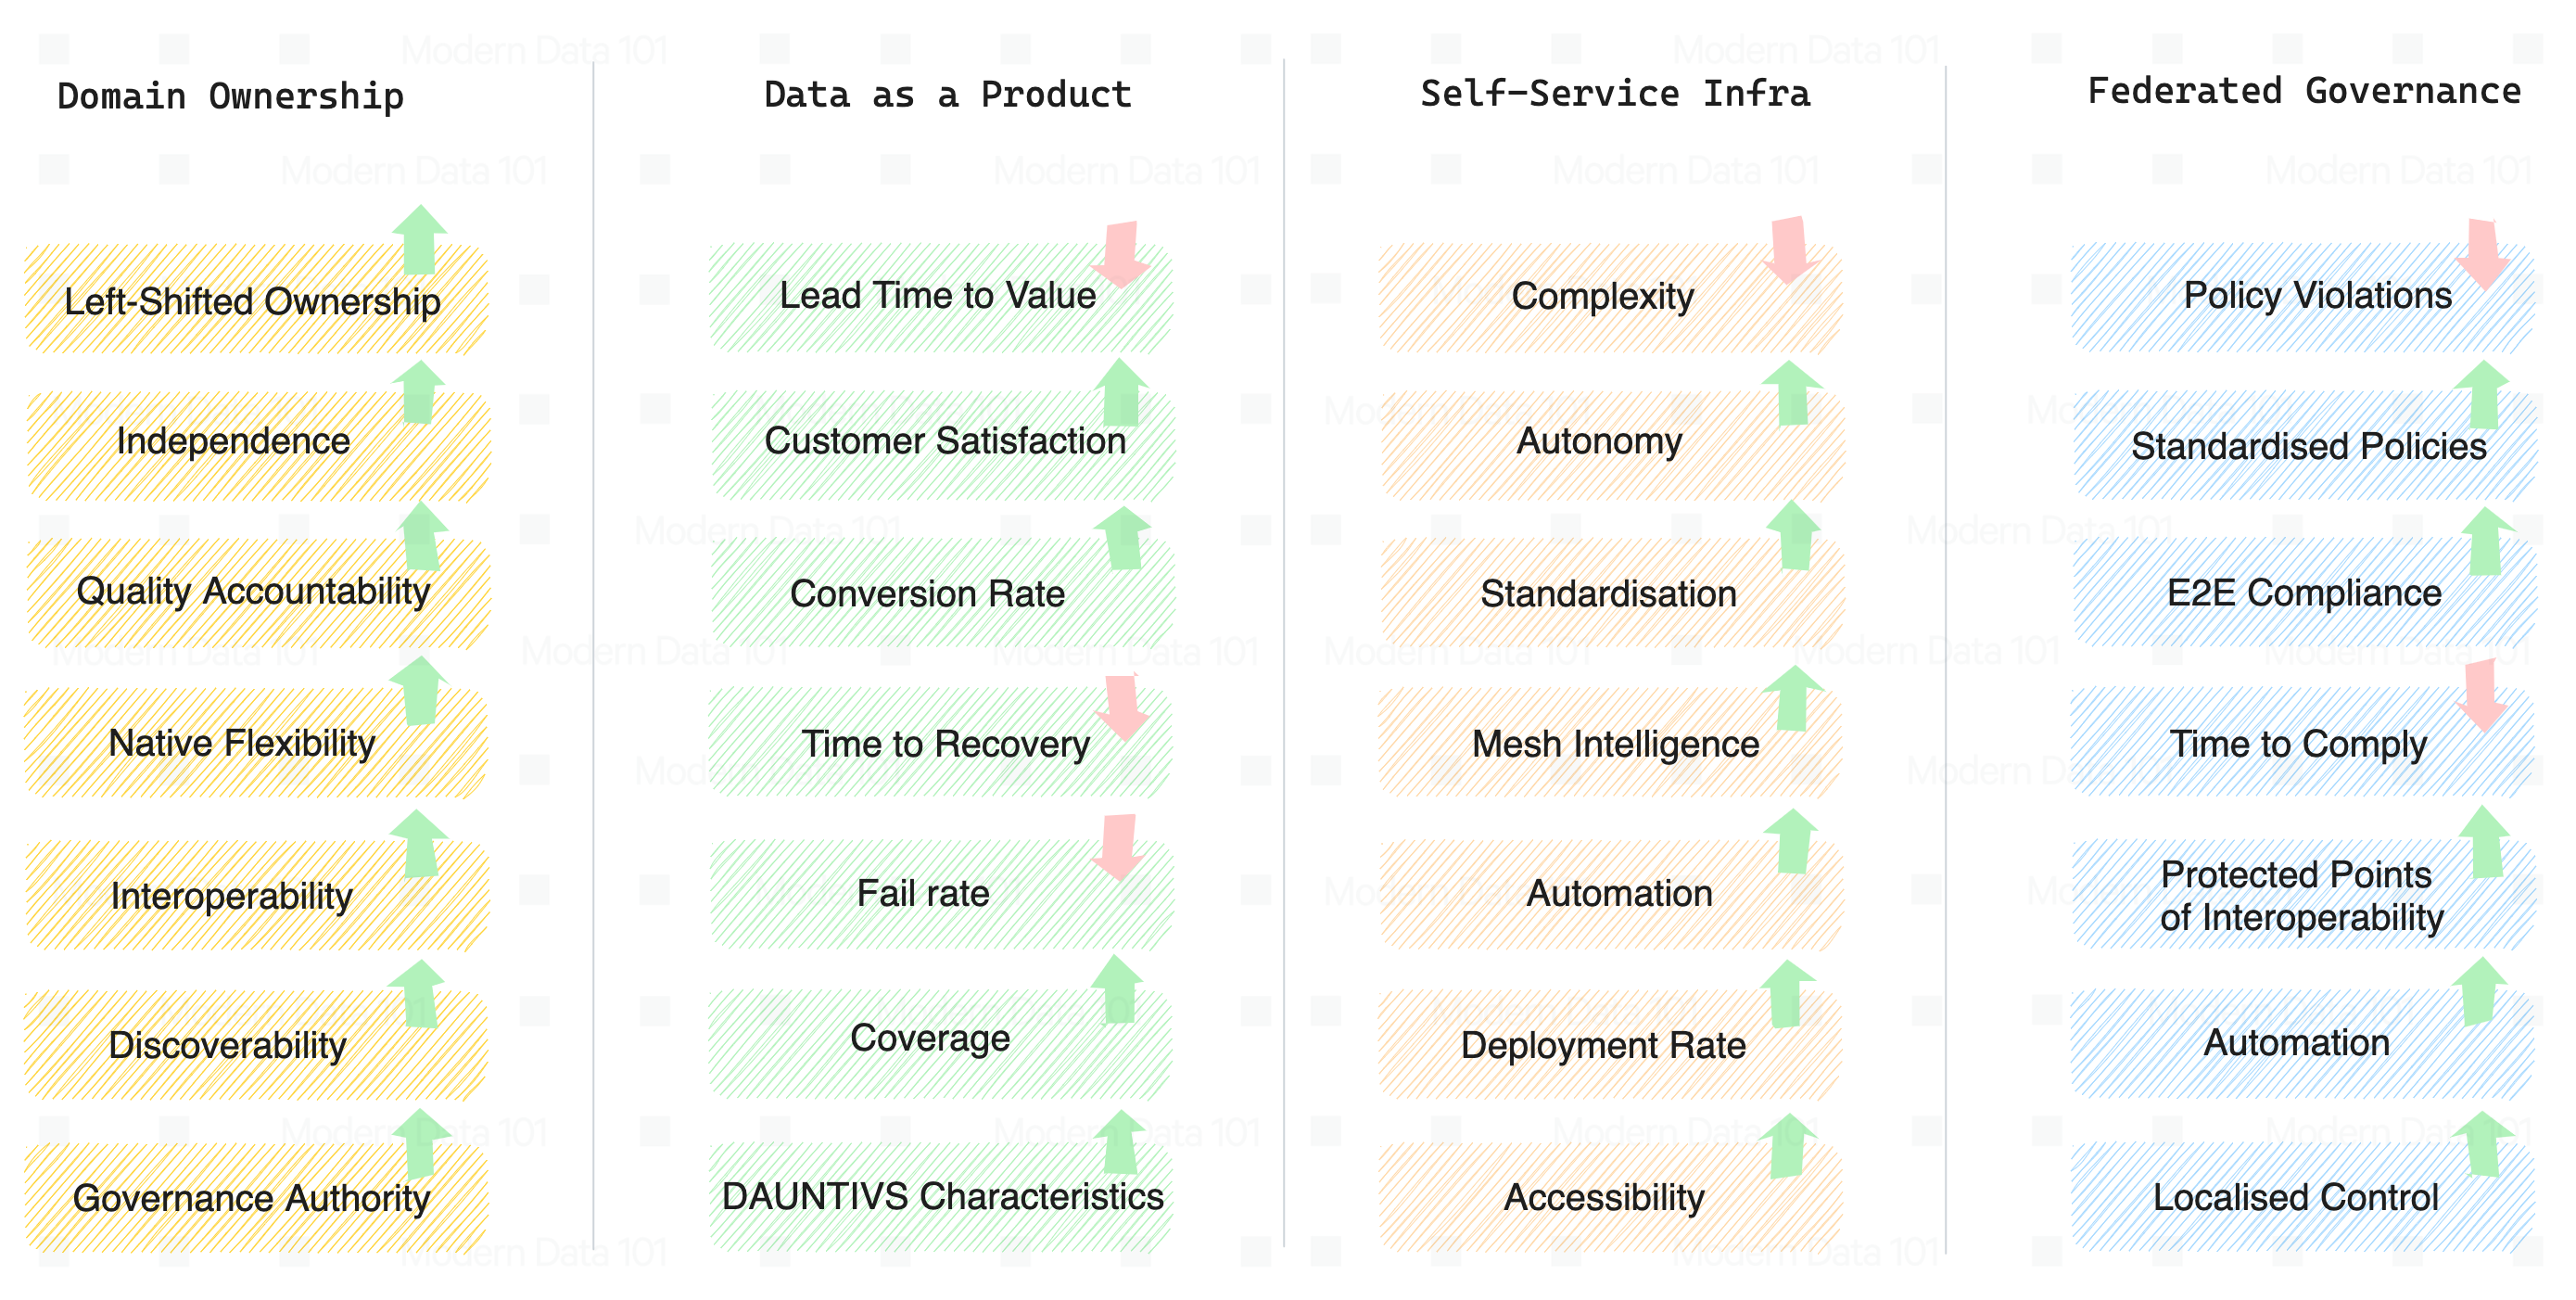
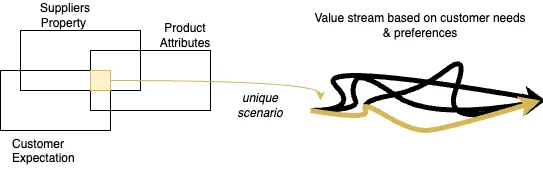
Given these principles are interrelated and correlate heavily, there are also some fitness parameters that are applicable at the points of conjunction. O’Reilly’s Data Mesh: Delivering Data-Driven Value at Scale talks about these points of interplay and illustrates the same compactly.
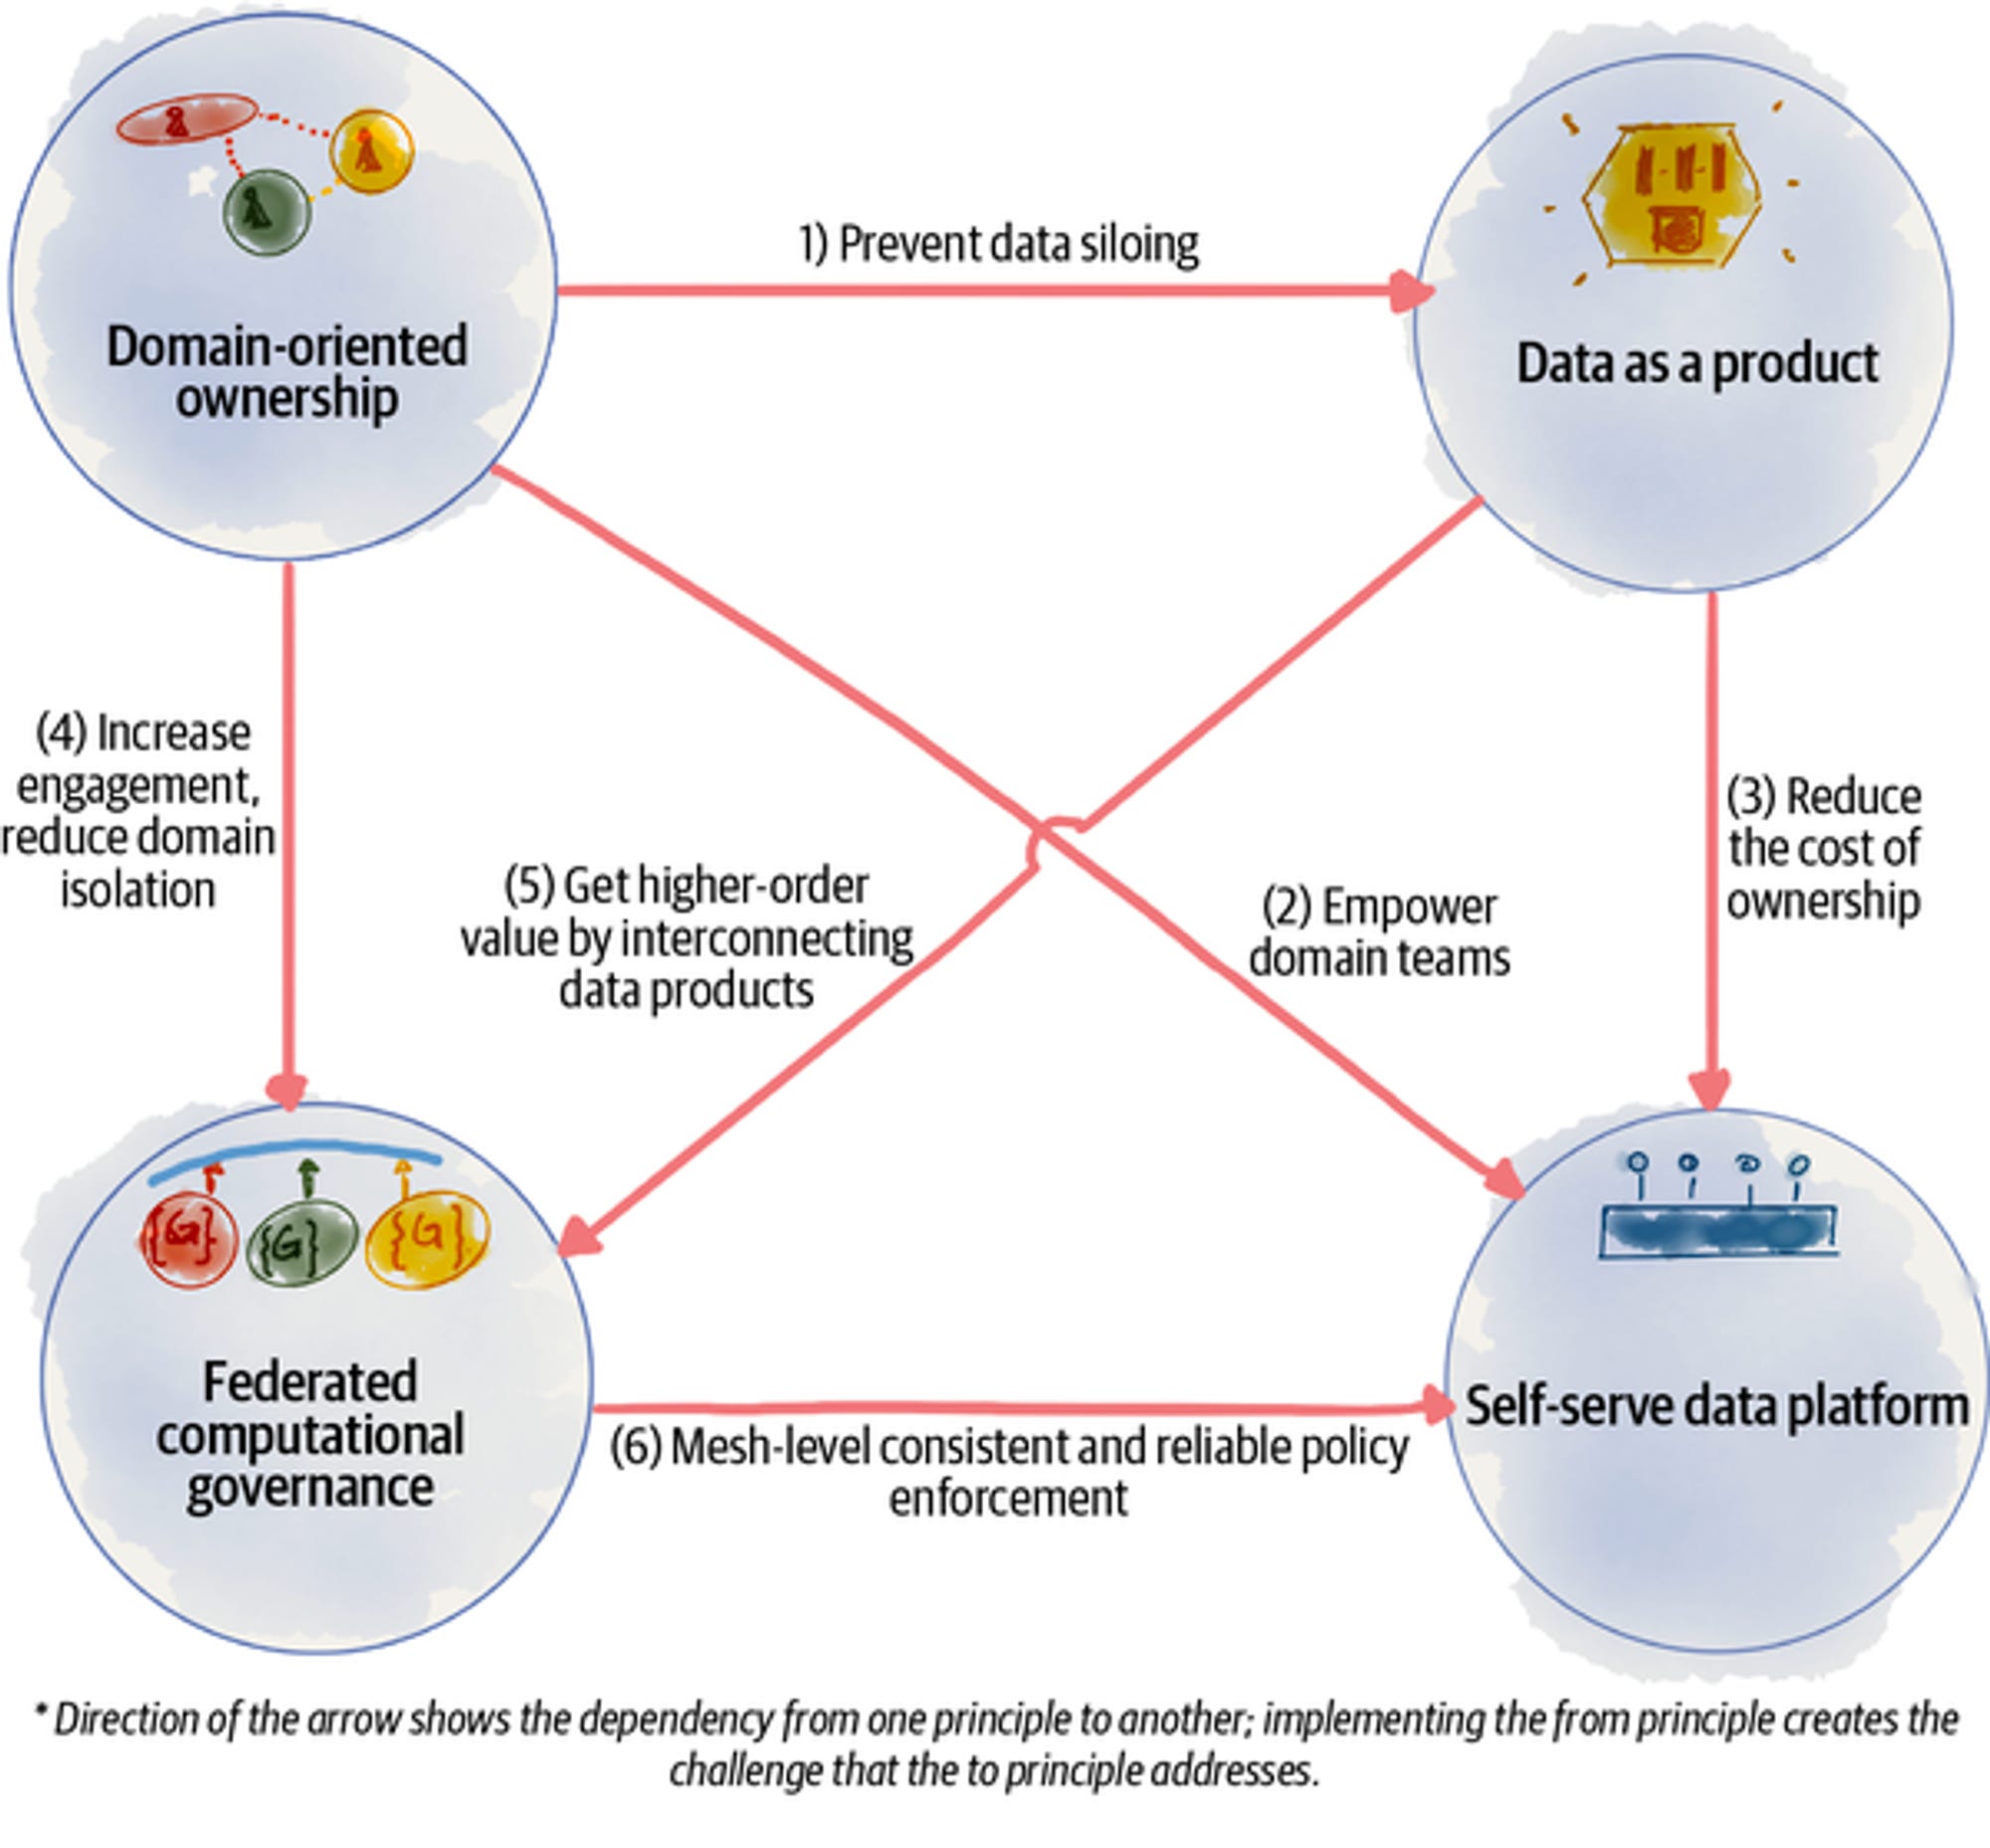
While these points represent the high-level objectives, there are several fitness parameters which contribute to establishing the objectives. A Data Developer Platform’s Evolve Phase enables the flexibility to domain and data teams to design standard and customised low-level fitness functions in context to the combined principles and observe them consistently across several iterations of the data product lifecycle.
This ends the Data Product Lifecycle Series, which brings us to practical use cases. The purpose of the lifecycle is to make the use of data more accurate, efficient, and simple for establishing valuable business objectives.
Watch this space for a real-world use case of the data product lifecycle, how it compares to the old process, and consequently, how it makes a difference to the different citizens of the data ecosystem.
We’ll also share resources around transitioning into data product ecosystems without having to make it a painful process, templates to embed the data product lifecycle into your data strategy, nuances around interoperability of data products you build with your existing or heavy investment tools, and more.
Refer to the end-to-end data product lifecycle below:
Stage 1: Designing Data Products
Stage 2: Developing Data Products
Stage 3: Deploying Data Products
Stage 4: Evolving Data Products
We are glad to co-author this piece with Manisha Jain, Lead Consultant at Thoughtworks. She has been a relentless collaborator, and we are delighted to be able to share her expertise with you.

More in collaboration with Manisha ➡️
How to Build Data Products? Deploy: Part3/4
Your Copy of the Modern Data Survey Report
Better decisions start with shared insight.
Pass it along to your team →
.avif)


Animesh Kumar is the Co-Founder and Chief Technology Officer at The Modern Data Company, where he leads the design and development of DataOS, the company’s flagship data operating system. With over two decades in data engineering and platform development, he is also the founding curator of Modern Data 101, an independent community for data leaders and practitioners, and a contributor to the Data Developer Platform (DDP) specification, shaping how the industry approaches data products and platforms.

Manisha automates critical projects, lauded by Business Team. Passionate about data architecture, designing products enabling businesses to be data-driven.

Helping #TechBrands with #TechMarketing & #TechLeaders with #PersonalBranding | Worked with #Forbes' Cloud 100 & #CBInsights' AI 100 brands

Making Data Products development easy

Find more community resources

Find all things data products, be it strategy, implementation, or a directory of top data product experts & their insights to learn from.
Connect with the minds shaping the future of data. Modern Data 101 is your gateway to share ideas and build relationships that drive innovation.
Showcase your expertise and stand out in a community of like-minded professionals. Share your journey, insights, and solutions with peers and industry leaders.


