


Access full report
Oops! Something went wrong while submitting the form.

🤍

Facilitated by The Modern Data Company in collaboration with the Modern Data 101 Community
Latest reads...

.png)


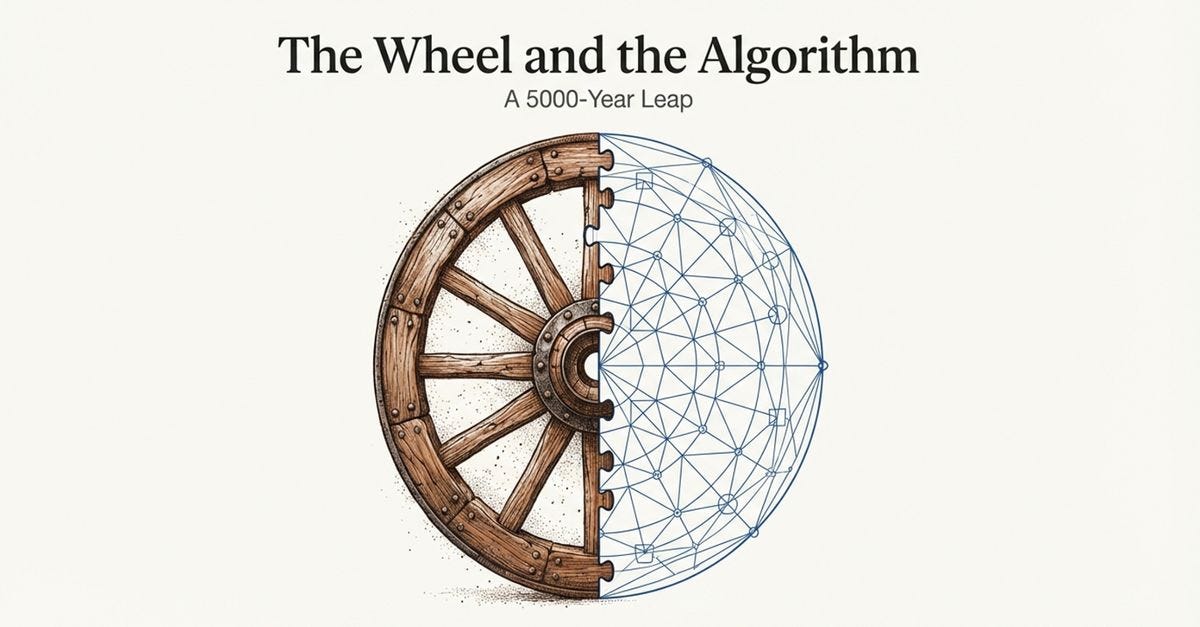

TABLE OF CONTENT


While we continue to get trampled by an overhaul of innovations, strategies, and frameworks, let’s cut out the overwhelm and come down to the first principles and fundamentals of what challenges we are trying to solve.
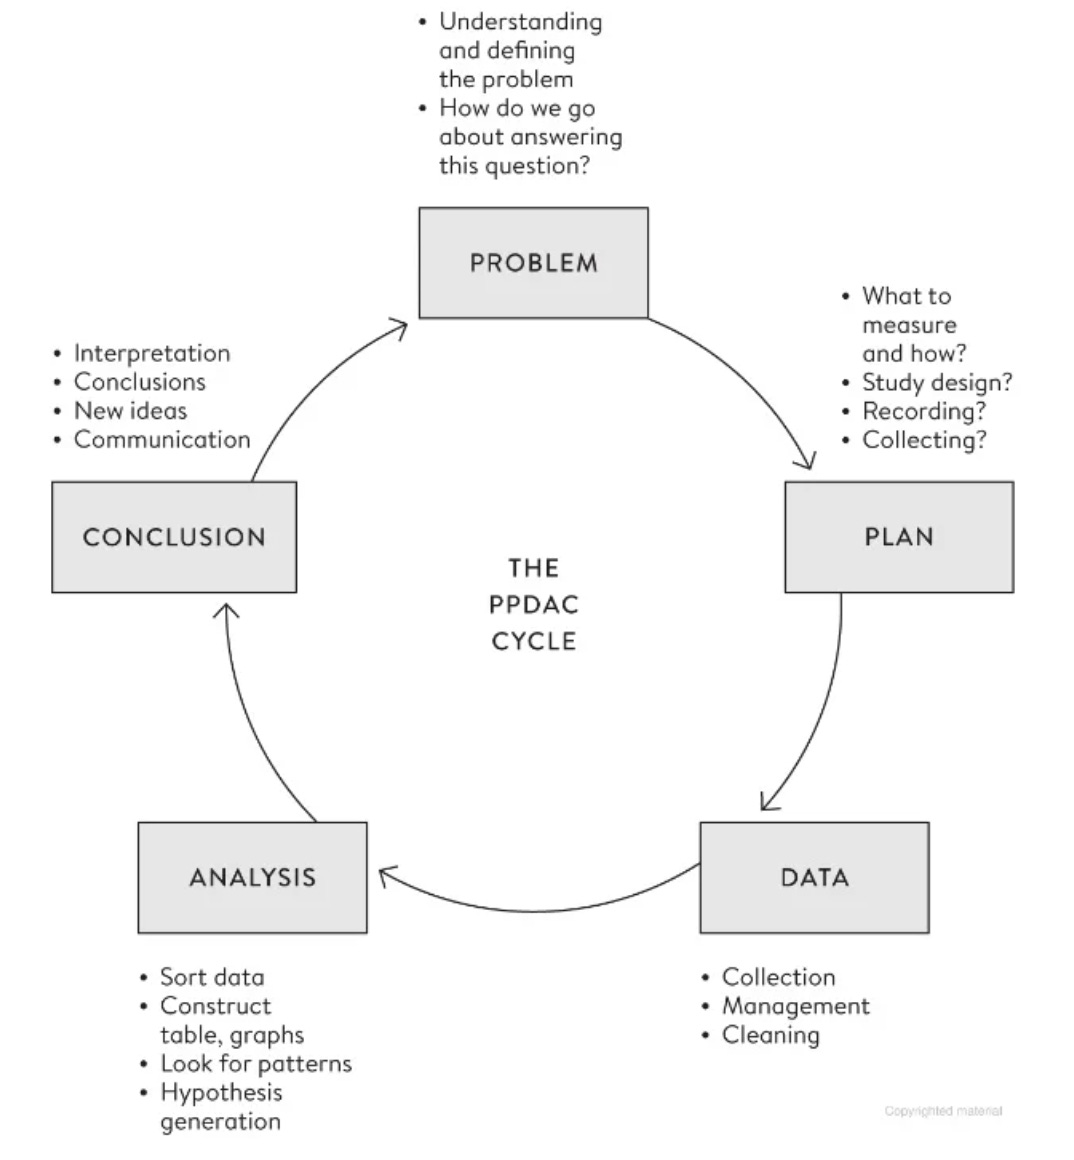
Broadly, with data, we fall into a PPDAC cycle:
While a data product is a framework, data teams would continue to spend most of their time understanding the data. So, the key question is how easily could this be enabled? How easily can data teams understand their data, access it for analysis, and process it for downstream applications?
In one of our recent threads, we approached this from an infrastructure point of view, where we enlisted the qualities necessary for any data infrastructure that intends to support data products.
But this cannot just be addressed by a deeply embedded infrastructure layer. How do we surface the infrastructure benefits to the data teams who are actually spending hours and weeks trying to understand the data?
Let’s face it. Data Products are, to some extent, still a vague construct for a large part of the community. As with all cycles, this, too, will take some time to reach peak awareness. So, when data developers, architects, and business guys are not quite high on clarity, they can easily fall into pits of significant collateral damage, especially in rigid legacy data stacks with high data debt.
Does that mean ignorance is bliss, and we should let the winds of change pass us by? Hardly. Data Product, though slightly muddy for the larger crowd, has significant tangible benefits. In fact, it’s one way to ground us against disruptive trends and innovations since it forms the fundamental building block of most data design frameworks.
The fundamentals don’t change nearly as fast as the latest tech de jour. Focus on what doesn’t change and build from there. ~ Joe Reis, Author of Fundamentals of Data Engineering
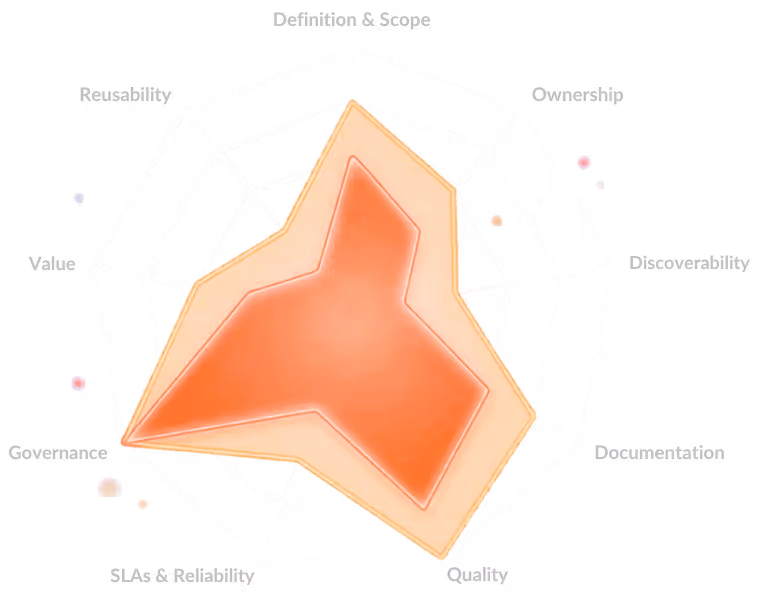
The qualities surfaced by the crisp container of Data Products have been desirable by data consumers since time immemorial and are unlikely to change shape anytime soon. Aka: Discoverable, Addressable, Understandable, Natively Accessible, Trustworthy, Interoperable, Independent, and Secure.
Innovation and experimentation are at the forefront of successful data teams, which is why innovation-aligned metrics such as cost of failed experiments, total cost of ownership of experiments, time to recovery, etc., are at the focal point of high-performance teams.
Data developers need a playground to run their experiments without causing a tangible impact on the data. In other words, a “Figma for Data Products”.
Just like Figma offers us an interface to design and play around with product wireframes without actually having backend teams do the hard work until a couple of wireframes are shortlisted, a Data Lens does the same for data products.
We refer to it as a “lens” because it instantly spins up a relatable visual and largely conveys the meaning in simple lingo. A data lens is, therefore, a way to zoom into data- a view or a collection of views. In technical terms, this is a semantic modeling playground.
Design multiple experimental Data Product wireframes first. Implement the backend for the top experiments later.
You define the problems first, identify gaps, metrics, and requirements, and then move on to unleash xyz technology to solve that challenge. A semantic modeling layer allows you to define not just the business logic but also the SLO requirements against every logical entity. In summary, you create the front-end design for your product.
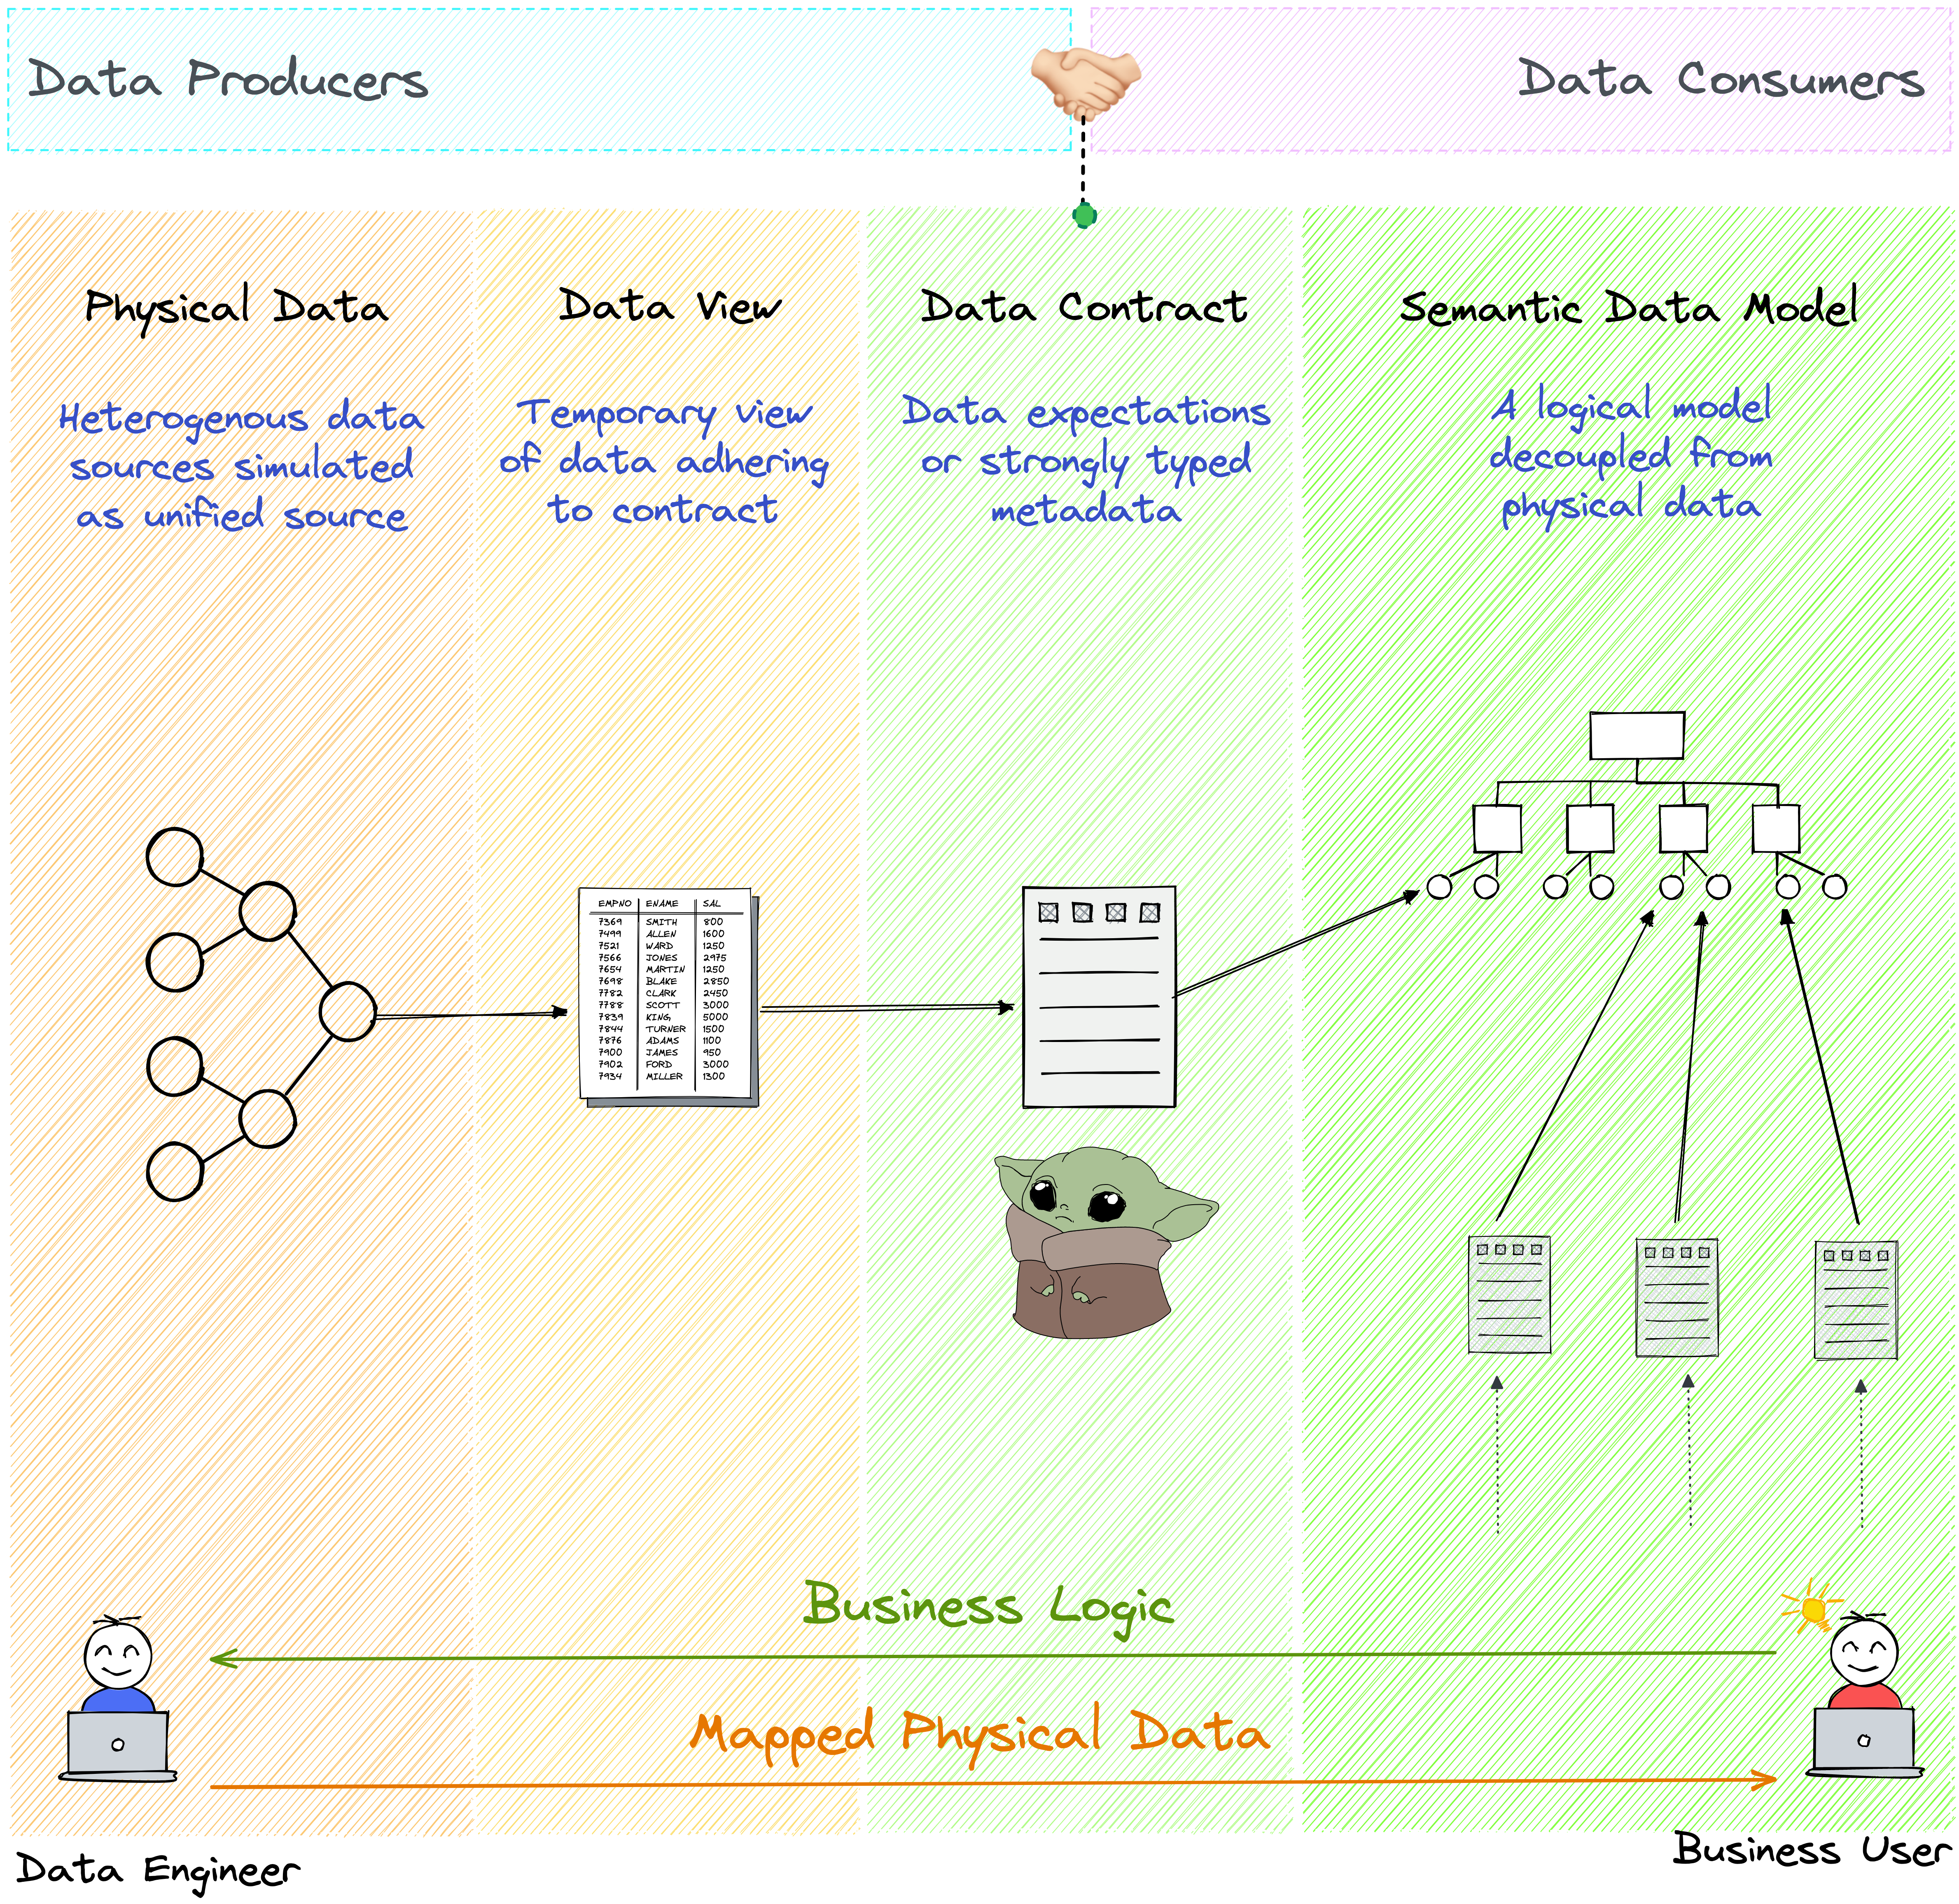
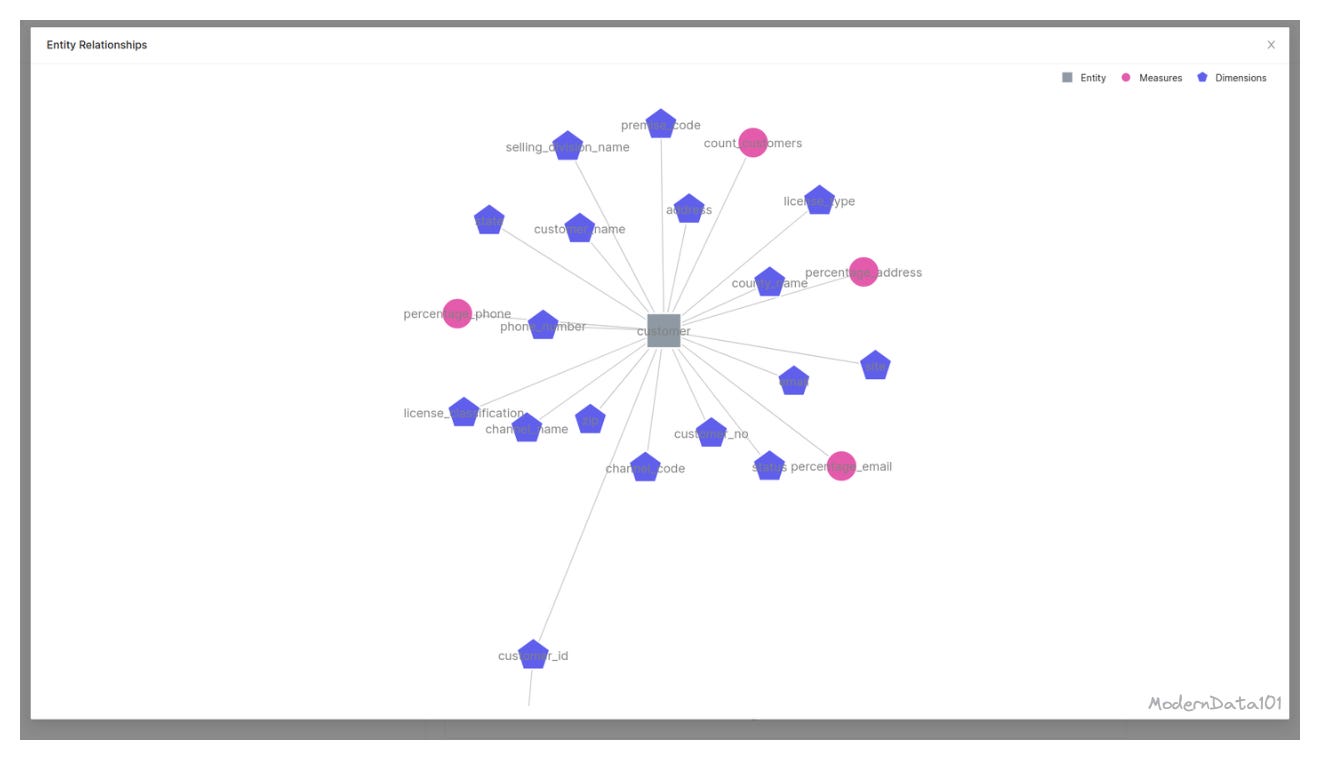
A semantic model essentially means a logical model or a set of views from across the contributing data sources. These data views allow you to access data from various sources consistently and build your minimum viable product without having to actually move the data over expensive pipelines.
Experiment and present without any actual data movement or migration. Play around with dataviews and combinations, explore data, and run experiments countless times with insignificant load on expensive resources before finalizing your data product.
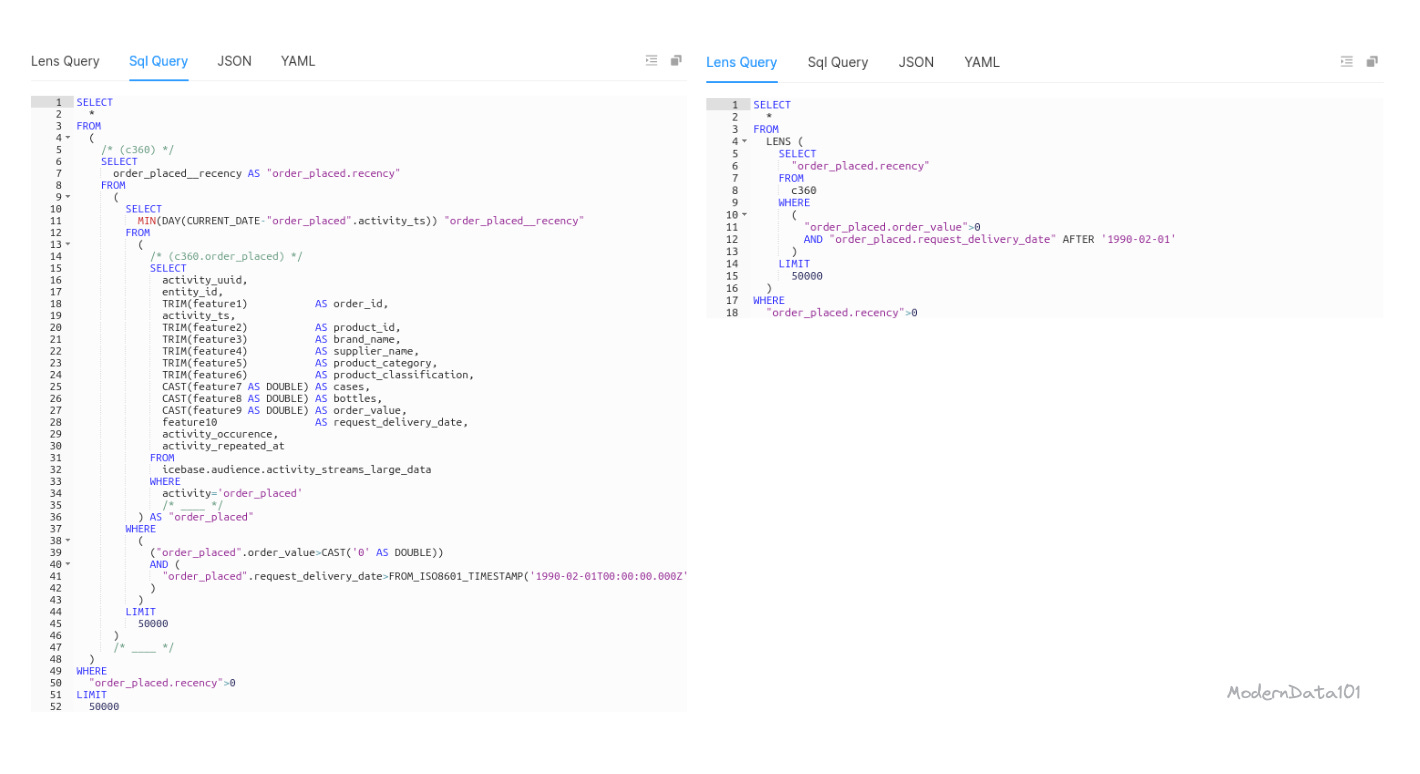
Users only materialise data when they are certain about the experiment or the logical channel. With this layer, you can simply use semantic queries in a few lines for fast trials instead of writing hundreds of lines of complex SQL joins. This implies access to relevant business objects and the ability to drill down on key performance indicators by dimensions.
Once the experiment proves to have potential and feasibility, the data consumer can choose to materialise the data from the physical sources to the output ports (channel data instead of views to their applications or output ports).
Data producers can refer to the consumer requirements defined in the semantic model to create and own data contracts for the data they produce. While the data engineering team maps the sources to the semantic models during the initial stages for facilitating data views, infrastructure resources for bearing the load of physical data movement are only provisioned when there is a demand for materialisation (provisioned as per the data load that the experiment needs to bear).}
Want to dive deeper? More on similar lines: Optimizing Data Modeling for the Data-First Stack
We discovered a gem recently- an approach to data products way back in 2012 published on O'Reilly Radar. Instead of being hung up on how they define data products or in which context (statistics & predictive modeling), let’s focus on their successful approach to the purpose that’s relevant even today: data products that transform the raw data into an actionable outcome. We could identify similar challenges and, therefore, similar challenges they deployed to
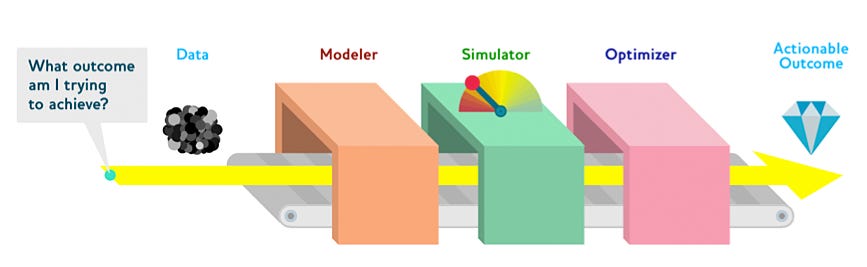
We are entering the era of data as drivetrain, where we use data not just to generate more data (in the form of predictions), but use data to produce actionable outcomes. That is the goal of the Drivetrain Approach.
“When dealing with hundreds or thousands of individual components models to understand the behavior of the full-system, a ‘search’ has to be done. I think of this as a complicated machine (full-system) where the curtain is withdrawn and you get to model each significant part of the machine under controlled experiments and then simulate the interactions. Note here the different levels:
1. models of individual components
2. tied together in a simulation given a set of inputs
3. iterated through over different input sets in a search optimizer.”
Essentially, this approach demands a simulated playground for experimentation to reach actionable insights sooner instead of deploying resource-heavy pipelines for every experiment. In essence, when it comes to data, be it data product or not, experimentation is a fundamental non-negotiable. Naturally, when it comes to Data Products, as we know them today, the ability to experiment without any collateral damage is probably the primary objective at this stage.
Reconnecting Chicago's Data & Analytics Leaders In-Person to Accelerate Their Data Transformation Strategies. In this event, you’ll get an opportunity to join your data & analytics peers as you discover the latest trends and how to overcome challenges facing your role.
Speakers Include - Vijay Rajandram(CDO - Northern Trust Asset Management), Sherri Adame(Data Governance Lead - General Motors), Milad Toliyati(CDAO Director of Analytics - Cisco), Flo Castro-Wright(CDO - CDC Foundation), and many such renowned folks from modern data space. Don’t miss your chance to gain insights into the latest trends and practices. Register on the link below!
Event Date: August 8-9, 2023
Mode: Offline
Register
TDWI Conferences provide industry-leading education for business and technology professionals, offering in-depth education, networking, and exposure to the latest technology offerings.
This six-day conference is designed for data professionals and leaders to learn about different aspects of data strategies, ML, Data Science and more! Last date to register for the event is 4th August, hurry up!
Event Date: August 6—11, 2023
Mode: Offline
Register
Executive Summit for Analytics Co-Located with TDWI San Diego
Event Date - August 8-9, 2023
Mode: Offline
Register
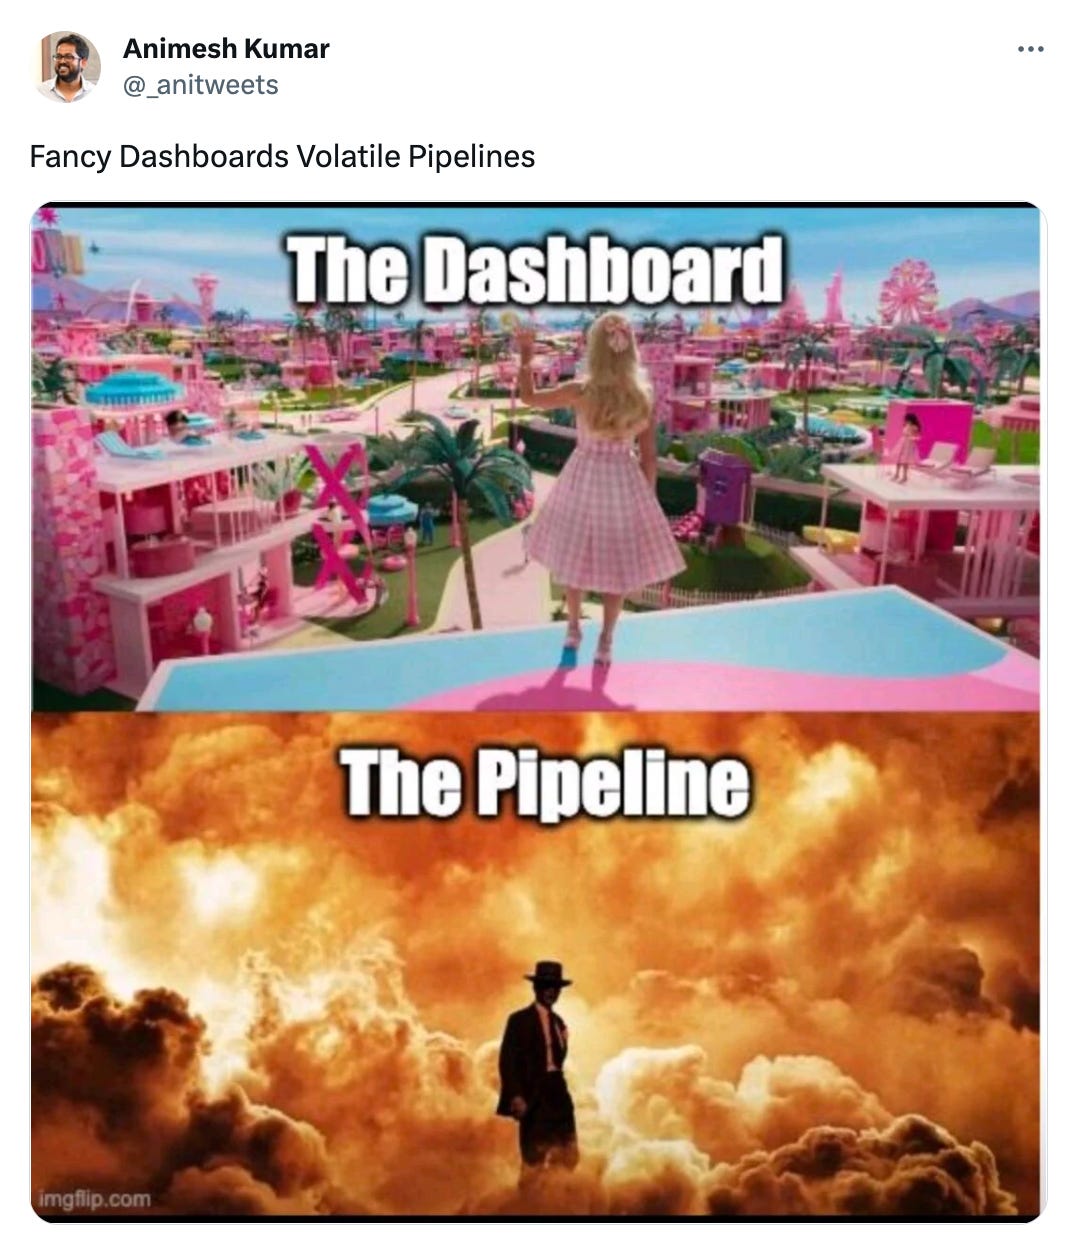
As usual, here’s a light breather for you for sticking till the end!
Follow for more on LinkedIn and Twitter to get the latest updates on what's buzzing in the modern data space.
Feel free to reach out to us on this email or reply with your feedback/queries regarding modern data landscapes. Don’t hesitate to share your much-valued input!
ModernData101 has garnered a select group of Data Leaders and Practitioners among its readership. We’d love to welcome more experts in the field to share their stories here and connect with more folks building for the better. If you have a story to tell, feel free to email the Editor!
Your Copy of the Modern Data Survey Report
Better decisions start with shared insight.
Pass it along to your team →
Your Copy of the Modern Data Survey Report
Better decisions start with shared insight.
Pass it along to your team →


Find more community resources
Modern Data 101 is a movement redefining how the world thinks about data. A community built by the same team behind the world’s first data operating system, Modern Data 101 sits at the intersection of data, product thinking, and AI. Spread across 150+ countries, the community brings together a global network of practitioners, architects, and leaders who are actively building the next generation of data systems.
At its core, Modern Data 101 exists to simplify the journey from raw data to tangible and observable impact. It advocates high-potential data systems and next-gen architectures to unify and activate insights and automation across analytics, applications, and operational workflows at the edge.
In a world shifting from data stacks to AI ecosystems, Modern Data 101 helps teams not just navigate the change but lead it.

Find all things data products, be it strategy, implementation, or a directory of top data product experts & their insights to learn from.
Connect with the minds shaping the future of data. Modern Data 101 is your gateway to share ideas and build relationships that drive innovation.
Showcase your expertise and stand out in a community of like-minded professionals. Share your journey, insights, and solutions with peers and industry leaders.


