

Access full report
Oops! Something went wrong while submitting the form.

🤍

Facilitated by The Modern Data Company in collaboration with the Modern Data 101 Community
Latest reads...

.png)

.png)


TABLE OF CONTENT


It is important to remember that managing data as a product guarantees interoperability, facilitates data and code reuse, and promotes an "as a product" approach, which includes considering the profitability of our digital product.
The steps we will follow are:
While the 'data as a product' paradigm might theoretically assign absolute economic values to calculate the profitability of our digital product, this is quite complex (if not unachievable) because it requires complete synergies among enterprise architecture layers. In the article, I will explore how this complexity may not necessarily hinder the initial purpose.
We will analyze all preparatory aspects, whether technological or methodological.
Assuming a basic level of observability is in place (both for determining costs and for usage), the real differentiating requirement is methodological. It is crucial to have a domain-driven organization (not necessarily a mesh) and a taxonomy that can assign meaning to the various data products. This taxonomy should also be distributed across different data products (data contracts) with potential impacts on the data governance model (data product owner).
In this sense, it is strongly recommended to have a federated modeling service to manage and guarantee this within the data architecture (regardless of whether it is distributed or not).
This is necessary because we will use the single element of the taxonomy, i.e., the entity data (and not the single data product), as the calculation element.
📝 Related Reads
- Domain-Driven Data Product Models + Metrics & Entities as First-Class Citizens in a Data Ecosystem
- Taxonomy (Classifying Data for Consistency and Clarity)
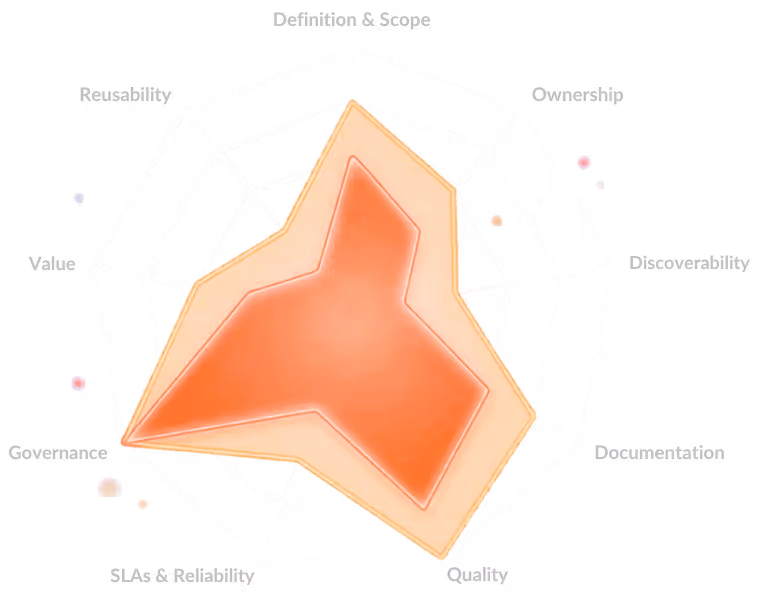
Secondly, it is necessary to select an evaluation model, for example, from this work:
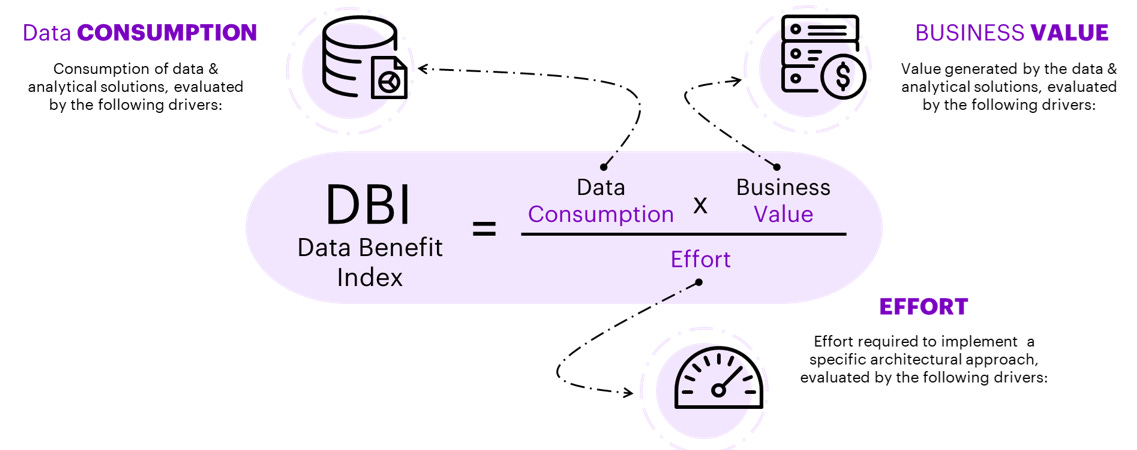
From which we can consider some drivers:
Obviously, each business context might select different drivers, but these seem sufficiently agnostic to be considered universal.
It is important to emphasize that not all drivers are economically quantifiable, so it will be necessary to reason in terms of function points or correlations.
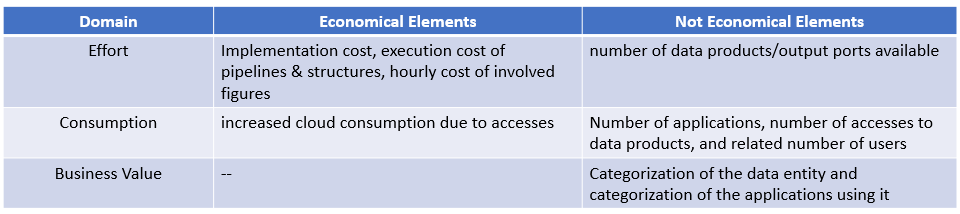
At this point, two actions are necessary:
This action is of fundamental importance because it will serve to identify the outliers (see below). In theory, the domains should come either from data governance or from the enterprise architecture group as instantiations of business processes.
Whichever choice is applied, it is important to reach the point where all data products have at least one business entity and are, therefore, allocable in a functional domain (for consumption data products, a series of scenarios dependent on the applied data governance model opens up).
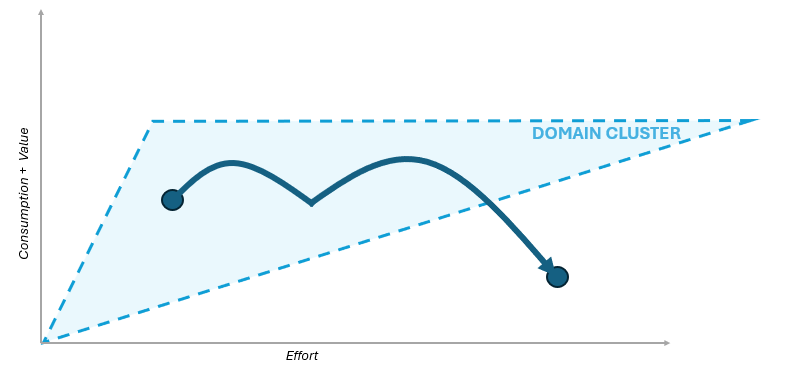
This activity is undoubtedly the most evident. After several months of simulations on real data, I concluded that there is no ideal mathematical formula but that we need to work in an incremental approach until we are able to achieve a distribution that should look like the following diagram:
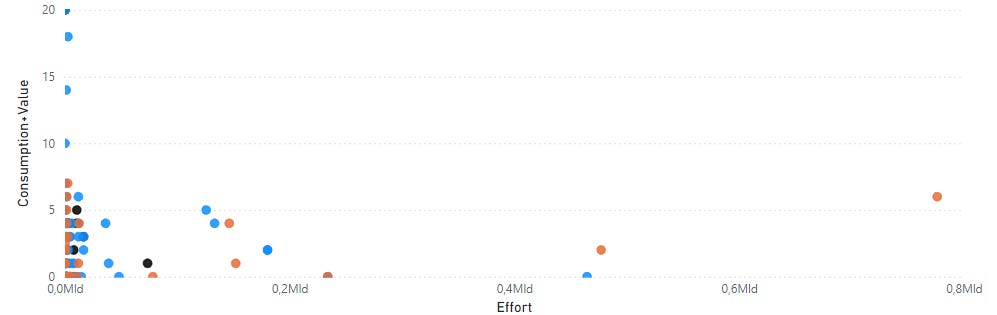
Some verification thumb rules adopted are:
At this point, you should be able to obtain a clustering like follows
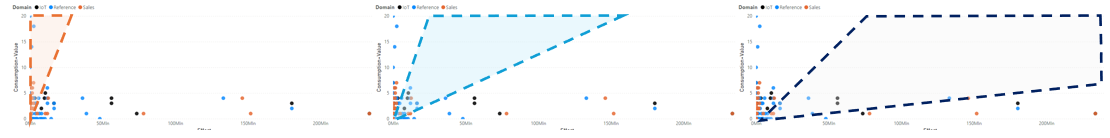
To explain the benefits of the approaches, I provide some examples from the dataset I am using:
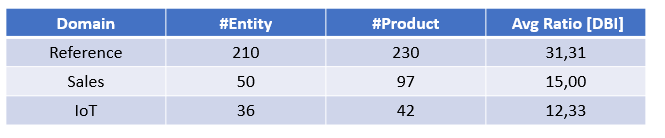
Where Avg Ratio is computed as the average ratio of (Consumption + Value) : (Effort) axis (similar to Data Benefit Index). This makes sense, in my opinion, that Reference data is usually more valuable than IoT data.
The analyses that can be performed are applicable both during the setup phase and recurring (I will apply them only to the "Reference" domain).
140 out of 230 products initially appeared unused (Consumption + Value equal to 0). Several causes for this phenomenon exist:
An analysis of product/entity assignments reveals that several entities are duplicated without a real reason other than the sedimentation of application layers. For these integrations, it is possible to consider the dismissal of duplicates or their integration into the correct entity (of the reference domain).
A very common phenomenon (but not relevant for a reference domain), in this case, it is also possible to consider reassignments and dismissals.
Applying these normalization actions leads to the following changes:
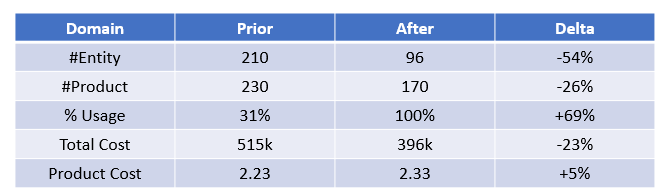
In detail, the benefits are due to the following actions:
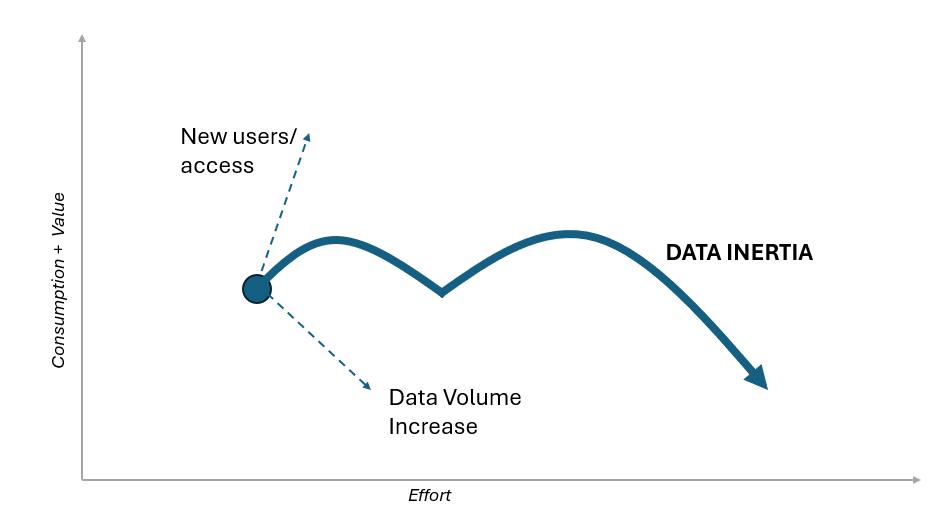
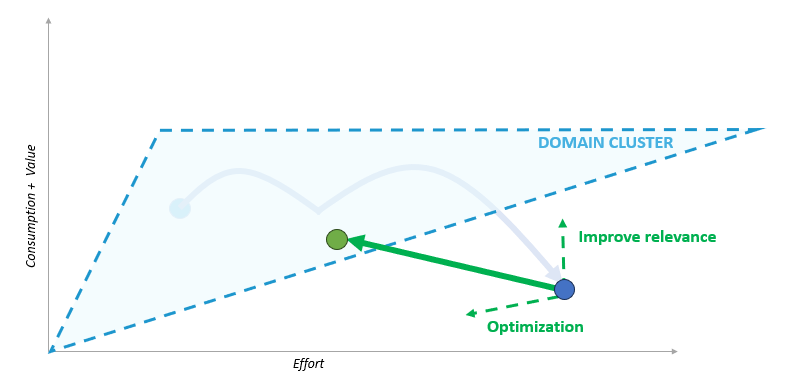
Following the initial run and the setup and tuning activities, it is necessary to consider how products and entities move within the diagram over time. Without proactive management, each entity could experience two seemingly opposite phenomena:
Both phenomena have a net result that shifts our product or data entity along the effort axis with a proportional decrease in generated value until it reaches the non-exercisable threshold.
This evolution could lead our entity outside the domain clustering, thus affecting it.
An entity that used to be a top performer could worsen its ranking over time.
This clustering approach allows evaluating not only the absolute worst-performing products but also enables the analysis of point decay (e.g., percentage) according to calculation functions that can be defined as needed (and which we won't elaborate on here). Share
These two contributions have a positive vector summation that improves the entity's performance and, thus, its intrinsic profitability.
📝 Related Reads
Versioning, Cataloging, and Decommissioning Data Products
The approach is certainly enabling as it allows for rationalization of the information assets both for the quantifiable component and for the intangible one (product quality, clear ownership).
However, it should be evaluated how to assign a business benefit for each initiative (theorized in enterprise architecture frameworks) and how to extend the model to products for which improvement actions cannot be applied (external products or those managed by regulatory constraints).
Suggested Further Monitoring Actions
Thanks for reading Modern Data 101! Subscribe for free to receive new posts and support our work.

Find me on LinkedIn
Your Copy of the Modern Data Survey Report
Better decisions start with shared insight.
Pass it along to your team →
Your Copy of the Modern Data Survey Report
Better decisions start with shared insight.
Pass it along to your team →


Find more community resources
Modern Data 101 is a movement redefining how the world thinks about data. A community built by the same team behind the world’s first data operating system, Modern Data 101 sits at the intersection of data, product thinking, and AI. Spread across 150+ countries, the community brings together a global network of practitioners, architects, and leaders who are actively building the next generation of data systems.
At its core, Modern Data 101 exists to simplify the journey from raw data to tangible and observable impact. It advocates high-potential data systems and next-gen architectures to unify and activate insights and automation across analytics, applications, and operational workflows at the edge.
In a world shifting from data stacks to AI ecosystems, Modern Data 101 helps teams not just navigate the change but lead it.

Find all things data products, be it strategy, implementation, or a directory of top data product experts & their insights to learn from.
Connect with the minds shaping the future of data. Modern Data 101 is your gateway to share ideas and build relationships that drive innovation.
Showcase your expertise and stand out in a community of like-minded professionals. Share your journey, insights, and solutions with peers and industry leaders.


